
 简体中文
简体中文 English
Website review
This review may include AI-generated content and is not individually verified. Domain, certificate and other facts come from the observed data on this page.
What is Open Analytics?
Open Analytics is a lightweight, real-time website analytics tool hosted at analytics.gitopen.dev. It focuses on showing what is happening on your site right now rather than only historical reports, and it markets itself as simple, fast, and privacy-friendly.
What it does
- Tracks core metrics: visitors, pageviews, sessions, bounce rate, and live activity.
- Shows a realtime visitor view with an interactive map, including which page someone is on and where they came from.
- Groups traffic sources, campaigns, referrals, and organic search performance in one place.
- Adds SEO-adjacent features: Domain Authority tracking, Search Console data, crawl and bot activity, and indexing behavior.
- Supports public dashboards that viewers can open without logging in.
How setup works
According to the page, there are three steps: sign in with Google or GitHub and create a project, copy one script tag into your HTML or Next.js layout, and events flow into your own PostgreSQL database. Each project gets a site key, and there is no separate analytics database to provision.
Who it suits
The page positions it for founders and small teams who want visitors, conversions, traffic sources, campaigns, and SEO performance without navigating dozens of unused reports. If you need deep funnel analysis, session replay, or a large experimentation suite, this is likely too narrow.
Practical next step
Open the live demo and watch the realtime view for a few minutes while you browse your own site in another tab. That tells you quickly whether the realtime map and source breakdown match how you actually work. If you want a second opinion on the category, compare with Plausible Analytics for simple privacy-first stats or Matomo if you need more control and reporting depth.
How does Open Analytics compare to Google Analytics for privacy-focused websites?
Open Analytics is built around realtime, lightweight tracking and a privacy-friendly posture, while Google Analytics is a broader marketing and reporting suite. For a privacy-focused site, the practical differences come down to data flow, setup effort, and how much reporting depth you actually need.
Where they differ in practice
- Data flow and storage: Open Analytics describes events flowing into your own PostgreSQL database via a single script tag, with no separate analytics database to provision. That matters if you want to control where visitor data lives. Google Analytics processes data on Google's infrastructure, which is convenient but outside your direct control.
- Realtime focus: Open Analytics emphasizes seeing visitors while they are still on the site, including an interactive visitor map and live activity. Google Analytics also offers realtime reporting, but its primary strength is historical reporting and audience segmentation.
- Setup: Open Analytics describes three steps: sign in with Google or GitHub, create a project, paste one script tag. Google Analytics typically requires creating a property, configuring data streams, and often adding consent management for privacy compliance.
- SEO and search context: Open Analytics combines analytics with Domain Authority tracking, Search Console data, and crawl/bot monitoring in one place. Google Analytics integrates with Search Console but does not include crawl or indexing monitoring natively.
- Sharing: Open Analytics supports public dashboards that viewers can access without logging in. Google Analytics sharing usually requires account access or exported reports, which is less convenient for clients or community transparency.
- Privacy compliance: Open Analytics markets itself as privacy-friendly, which may reduce the need for cookie banners depending on your jurisdiction and configuration. Google Analytics generally requires more explicit consent handling in regions like the EU.
A quick comparison
| Aspect | Open Analytics | Google Analytics |
|---|---|---|
| Data ownership | Events land in your PostgreSQL | Processed on Google infrastructure |
| Realtime view | Core feature, live map | Available but secondary |
| Setup | One script tag, minimal config | Property and stream setup, often consent tooling |
| SEO/crawl data | Built-in Domain Authority, Search Console, bot monitoring | Search Console integration only |
| Public sharing | Public dashboards, no login | Account-based access |
| Reporting depth | Focused on visitors, sources, campaigns | Extensive segmentation, funnels, audiences |
Who should choose which
- Choose Open Analytics if you run a privacy-sensitive site, want to own your analytics data, need quick realtime visibility, or want SEO and crawl signals alongside traffic stats without juggling multiple tools.
- Choose Google Analytics if you need deep audience segmentation, advanced attribution modeling, or tight integration with Google Ads and the wider Google marketing ecosystem.
Next step
Start with a concrete question: do you need to control where visitor data is stored, or do you need deep marketing attribution? If data control and simplicity win, try Open Analytics on a single project and compare the realtime view against Google Analytics for one week. If attribution and audience depth win, stay with Google Analytics and layer a lightweight realtime tool alongside it.
For reference, you can compare official product information at Open Analytics and Google Analytics.
How do I set up Open Analytics on my website?
Setting up Open Analytics takes three steps: create a project, copy one script tag into your site, and let events flow into your PostgreSQL database.
The setup steps
- Create a project. Sign in with Google or GitHub, then create a website in the dashboard. Each project gets its own site key, so you don't need to provision a separate analytics database.
- Add the script. Copy the single script tag into your HTML or your Next.js layout. Visitor events POST to your Open Analytics server and land in your PostgreSQL database.
- Check the data. Open the realtime view to confirm visitors, pageviews, sessions, and bounce rate are arriving, then use the live demo as a reference for what a populated dashboard looks like.
What you get once it's running
- Realtime activity — a live visitor map showing who is on the site now, which pages they're viewing, and where they came from.
- Traffic sources — campaigns, referrals, and organic search grouped in one place.
- SEO signals alongside analytics — Domain Authority, Search Console data, and SimilarWeb insights without switching tools, plus crawl and search-bot monitoring to see when Google discovers or revisits content.
- Public dashboards — shareable views for clients, teammates, or investors that viewers can open without logging in.
A practical tip before you paste the script
Decide where the tag belongs in your stack first. In a plain HTML site it goes in the shared layout or footer so it loads on every page. In Next.js, put it in the root layout rather than individual pages, otherwise you'll miss traffic on routes you add later. If you use a cookie banner or consent tool, check whether your setup requires the script to wait for consent before firing.
Choosing a plan
The Startup plan is free to apply for and covers up to 100 projects for one year, which suits founders running several small sites or side projects. Paid plans come with a 14-day free trial. If you're evaluating alternatives for comparison, Plausible Analytics and Umami take similar privacy-friendly, lightweight approaches, while Matomo offers deeper configuration if you need it.
Next step: create one project for your main site, install the script, and confirm a realtime visit appears before rolling it out to your other properties.
Can I share Open Analytics dashboards with clients without giving them account access?
Yes. Open Analytics is built around public dashboards that viewers can open without logging in, so you can give clients a read-only view of their traffic without handing over account credentials. The page explicitly lists sharing dashboards with clients, teammates, investors or a community as a use case, and notes that no login is required for viewers.
H3 What this looks like in practice
- You keep the account, project settings and site key under your own login (Google or GitHub sign-in is mentioned).
- You generate or enable a public dashboard for a project and send that link to the client.
- The client sees the live and historical reporting — visitors, pageviews, sessions, bounce rate, traffic sources, campaigns, referrals and search performance — but has no dashboard controls or account access.
H3 Where the trade-off sits
A public link is convenient, but it is also public: anyone who has the URL can view it. If a client's data is sensitive, treat the link itself as the secret — share it privately, avoid posting it in open channels, and rotate or disable it if it leaks. If you need per-client separation, the practical pattern is one project per client, each with its own dashboard, rather than one shared view across all your work.
H3 A concrete scenario
A freelance developer with five client sites creates five projects. Each client gets a single dashboard link they can bookmark; the developer keeps one login and never issues client accounts. When a client asks "where is my traffic coming from this week?", they check the dashboard themselves instead of emailing for a screenshot.
H3 Decision criterion
Choose public dashboards if your priority is zero-friction client access and the data is not confidential. If you need access control, per-viewer permissions or an audit trail of who viewed what, a public link will not meet that requirement — you would need a tool with authenticated viewer roles. For comparison, Plausible Plausible Analytics and Fathom Fathom both offer shared dashboard links, while Matomo Matomo supports more granular user roles if strict access control matters.
Next step: decide whether each client needs their own project, then confirm how the public dashboard link is generated in your account before promising a client a specific view.
What does the free Startup plan include and how do I qualify?
The free Startup plan gives you Open Analytics at no cost for one year, covering up to 100 projects. You apply for it rather than getting it automatically, and it's aimed at startups rather than general personal use.
What's included
- One year free on the Startup plan.
- Up to 100 projects — enough for multiple sites, client work or side experiments under one account.
- The same core product as paid plans: realtime visitor tracking, pageviews, sessions, bounce rate, traffic sources and campaigns, plus an interactive visitor map.
- Public dashboards you can share with clients, teammates or investors without them needing a login.
- SEO-oriented extras mentioned on the page: Domain Authority tracking, Search Console data and SimilarWeb insights, plus crawl and indexing monitoring.
How to qualify
The page states the Startup plan is "free to apply" — so the practical step is to sign up (Google or GitHub), create a project, and submit the application from the dashboard. The page doesn't spell out the eligibility criteria, so treat any specific revenue, funding or company-age threshold as something to confirm with Open Analytics directly before you rely on it.
Setup, in three steps
- Sign in with Google or GitHub and create a website in the dashboard; each project gets a site key.
- Paste one script tag into your HTML or Next.js layout.
- Events flow into your own PostgreSQL database — no separate analytics database to provision.
Trade-offs worth weighing
The one-year window means you should plan for what happens at renewal: if you're running many projects by then, migrating or paying could be a real cost. The PostgreSQL-backed, self-hosted-style approach also appeals to teams who want their event data in their own database, but it assumes you're comfortable with that stack. If you just want a quick look before committing, the paid plans offer a 14-day free trial, and there's a live demo on the site.
For comparison on the free tier of a mainstream alternative, see Plausible Analytics.
How does Open Analytics combine SEO insights like Domain Authority and Search Console data with website analytics?
Open Analytics folds SEO signals into the same dashboard as your traffic data, so you can connect search visibility to actual visits rather than checking two tools.
What gets combined
- Domain Authority tracking sits alongside your analytics, giving a rough authority benchmark next to traffic trends.
- Search Console data is pulled in so you can see how the site performs in search without leaving the analytics view.
- SimilarWeb insights add an outside estimate of traffic and competitive context.
- Crawl and indexing monitoring shows when search engine bots visit, revisit, or skip your content.
- Traffic-source and campaign tracking ties visits back to organic search, referrals, and campaigns.
The practical value is correlation. If Domain Authority rises but organic sessions stay flat, or if Search Console impressions climb while on-site sessions don't, the gap is visible in one place. That's the kind of mismatch that's easy to miss when analytics and SEO live in separate tools.
A concrete scenario A founder notices organic sessions dipped last week. In the same view they check crawl activity and see Googlebot stopped revisiting a key section, while Search Console impressions for those pages fell. The likely cause — a recent site change blocking or discouraging crawlers — becomes a fixable technical issue rather than a mystery traffic drop.
Where it fits and where it doesn't This suits founders and small teams who want a single lightweight view of traffic plus search health, and who don't need deep analyst-grade reporting. It's less suited to teams needing granular keyword-level rank tracking or complex attribution modeling; the SEO layer here is directional, not a full SEO suite.
Next step Before committing, open the live demo and check whether the Search Console and Domain Authority panels show the specific metrics you'd actually act on. If they do, the setup is a single script tag, and you can compare it against a dedicated analytics tool like Plausible or a search-focused platform like Ahrefs to decide whether combining beats specialising.
 Cloudflare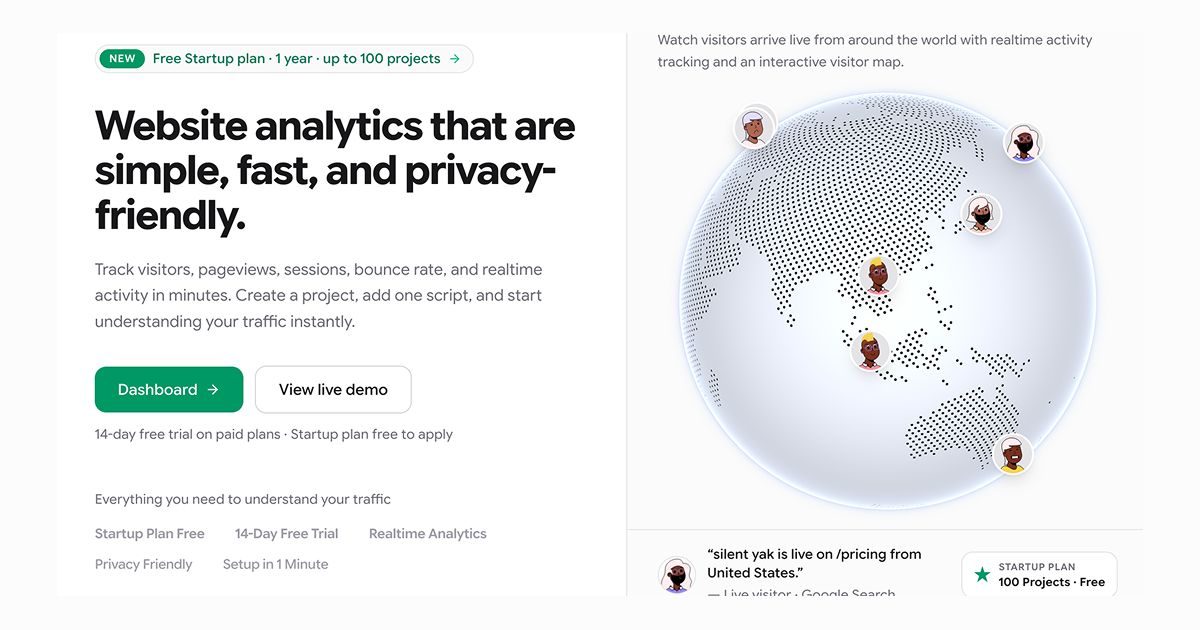

User reviews (0)