
 Paid content
 Visit website
 Updated: 2026-09-03 15:23
 Language: English (default)
 Access: Normal
 Profile views 12
  Outbound visits 11
 Website Review
What is ApexCharts.js?
ApexCharts.js is a JavaScript charting library for building interactive charts and visualizations on websites and web applications. It is aimed at developers who want a simple API to render charts without adopting a full framework.
What it offers
- A library of common chart types, such as line, bar, area, pie, donut, radar and heatmap
- Interactivity like tooltips, zooming, panning and legend toggles
- A configuration-based API, so charts are defined mostly through options objects rather than long drawing code
- Integration options for frameworks and wrappers, which may suit teams already using React, Vue or similar tools
Who it is for
It typically fits front-end developers, data analysts and product teams that need dashboards, reports or embedded visualizations. Because it runs in the browser, it can work with data delivered from an API or generated on the page.
Trade-offs
The simple API can speed up development, but highly specialized or unusual visualizations may require extra customization or a different tool. Teams should also review the official pricing page for licensing details, since commercial use terms are not covered here.
ApexCharts.js is available at ApexCharts.js.
How do I install and get started with ApexCharts.js?
ApexCharts.js is a JavaScript charting library for building interactive charts and visualizations through a relatively simple API. It is typically used by web developers who need dashboards, reports or embedded data graphics without writing a charting engine from scratch.
Installation options
- npm or yarn: Install the package into a modern build setup, then import the library into your JavaScript or framework components. This suits React, Vue, Angular, Svelte and similar projects.
- CDN script tag: Add a script reference to a plain HTML page. This suits quick prototypes, static sites and environments without a bundler.
- Framework wrappers: Official and community wrappers exist for several frameworks, which can simplify component lifecycle handling.
Basic getting-started flow
- Include or import the library.
- Create a container element with a defined width and height.
- Define a configuration object containing chart type, series data, axes and labels.
- Instantiate the chart against the container, then update options or data as needed.
Trade-offs
The API is approachable for common chart types, and configuration is largely declarative. Highly specialized visualizations may require custom work. For alternatives, see Chart.js and D3.js. Documentation and examples are available at ApexCharts.js.
Which chart types does ApexCharts.js support?
ApexCharts.js is a JavaScript charting library for building interactive visualizations on websites and web apps. Its API covers a broad range of chart types, so you can often use one library for dashboards, reports and embedded analytics rather than mixing several tools.
Commonly supported chart types
- Line, area and spline charts, including stacked and stepped variants
- Bar and column charts, horizontal and stacked
- Pie and donut charts
- Scatter and bubble charts
- Candlestick and box plot charts for financial or statistical data
- Radar, heatmap, treemap and polar area charts
- Radial bar and gauge-style charts for progress or KPIs
Practical considerations
Most types support interactivity such as tooltips, zoom, pan, legends and data labels, which suits dashboards and exploratory interfaces. The library renders with SVG by default, which helps with crisp scaling and accessibility, though very large datasets may benefit from a canvas-based alternative.
ApexCharts.js is typically used by front-end developers who want a readable configuration object rather than deep drawing code. It is less suited to highly specialized scientific or 3D plotting. For official details, see ApexCharts.js.
Is ApexCharts.js free to use, and what are its pricing options?
ApexCharts.js is an open-source JavaScript charting library distributed under the MIT licence, so the core library can be used at no cost. You can install it from npm or include it via a script tag, and use it in personal, commercial and open-source projects without paying for the charting code itself. The project does publish a pricing page, which indicates that paid options exist alongside the free library.
What the paid options typically cover
Paid plans for libraries like this usually fund development and add support or extra tooling rather than unlocking the charts themselves. Common inclusions are:
- Priority technical support and faster response times.
- Additional chart types, plugins or editor tooling.
- Team or enterprise licensing terms and invoicing.
Exact tiers, prices and what each plan includes are not stated here, so check the official pricing page for current details.
Who it suits
Developers building dashboards, admin panels or analytics views in plain JavaScript or frameworks such as React, Vue and Angular are the main audience. The simple API and sensible defaults make it quick to get a chart on screen, and interactivity such as tooltips, zoom and export is built in. For teams needing guaranteed support or commercial add-ons, a paid plan may be worthwhile; for most projects, the free version is enough. Compare with Chart.js if you want a lighter, canvas-based alternative.
How does ApexCharts.js compare to other JavaScript charting libraries like Chart.js or D3.js?
ApexCharts.js is a JavaScript charting library aimed at developers who want interactive, good-looking charts without assembling every piece themselves. Its API is configuration-driven: you describe series, axes and options in a JavaScript object, and the library renders SVG charts. That places it between Chart.js, which is similarly declarative but narrower in chart variety, and D3.js, which is a low-level toolkit for building custom visualisations from primitives.
Typical trade-offs
- Chart.js is lightweight and simple, with a smaller default feature set. ApexCharts.js typically offers more built-in chart types and interaction features, such as zooming, brushing, synchronized charts and annotations, at the cost of a larger bundle.
- D3.js gives maximum control and is suited to bespoke or unusual visualisations, but requires far more code and design decisions. ApexCharts.js trades that flexibility for speed of implementation.
- ApexCharts.js supports both SVG and, for some chart types, canvas rendering, which may help with large datasets.
Where it fits
It suits dashboards, admin panels and reporting interfaces where teams need many chart types quickly, and works with frameworks including React and Vue through wrappers. If you need a very small footprint, Chart.js may be preferable; if you need complete visual freedom, D3.js remains the stronger choice.
See ApexCharts.js for its chart types and API documentation.
Can I use ApexCharts.js with frameworks like React, Vue, or Angular?
ApexCharts.js is designed as a framework-agnostic JavaScript charting library, so it can work with React, Vue, and Angular. The core library renders charts in the browser and exposes a simple API, which means you can integrate it into any of these frameworks by mounting a chart to a DOM element and passing options and data.
For each framework, the practical difference is mainly in how you wrap and manage the chart instance:
- React: You typically create a component that initializes the chart in an effect and updates it when props change.
- Vue: You can bind chart options and data reactively, then call the chart's update methods when they change.
- Angular: You usually place the chart inside a component, initialize it after the view is ready, and handle updates through the component lifecycle.
A key trade-off is that ApexCharts.js is not itself a React/Vue/Angular component library; you are responsible for the wrapper logic. This gives flexibility but may require more manual wiring than a framework-specific charting package. It is well suited to teams that want one charting API across multiple frameworks or that already use ApexCharts.js on a non-framework site. For framework-specific wrappers, you may find community packages, but the official library remains the foundation. See ApexCharts.js for documentation and examples.
 Hosting and Email
 Amazon Route 53
 Hosting
 Zoho Mail
 Location
 Ashburn, Virginia, United States
 Pages, Search and Sharing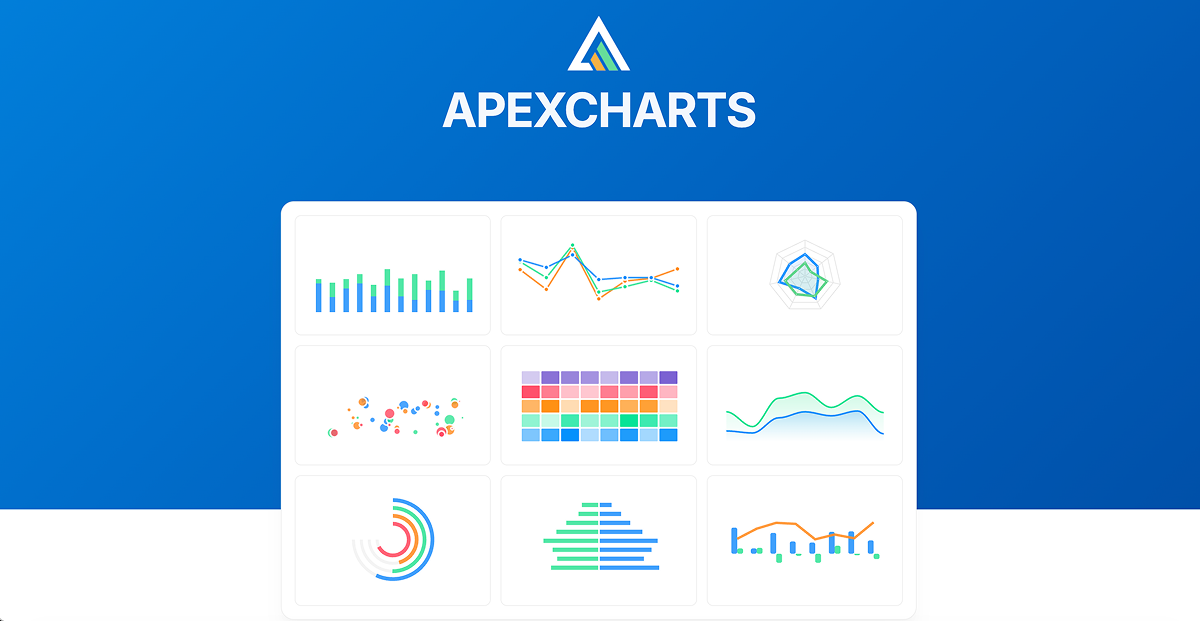


 All bots


 Registration details RDAP / WHOIS
 TLS and certificates
 HTTP response headers
 Identified technologies
User reviews (0)