Website profiles · Technology insights · Alternatives

computer.tldraw.com

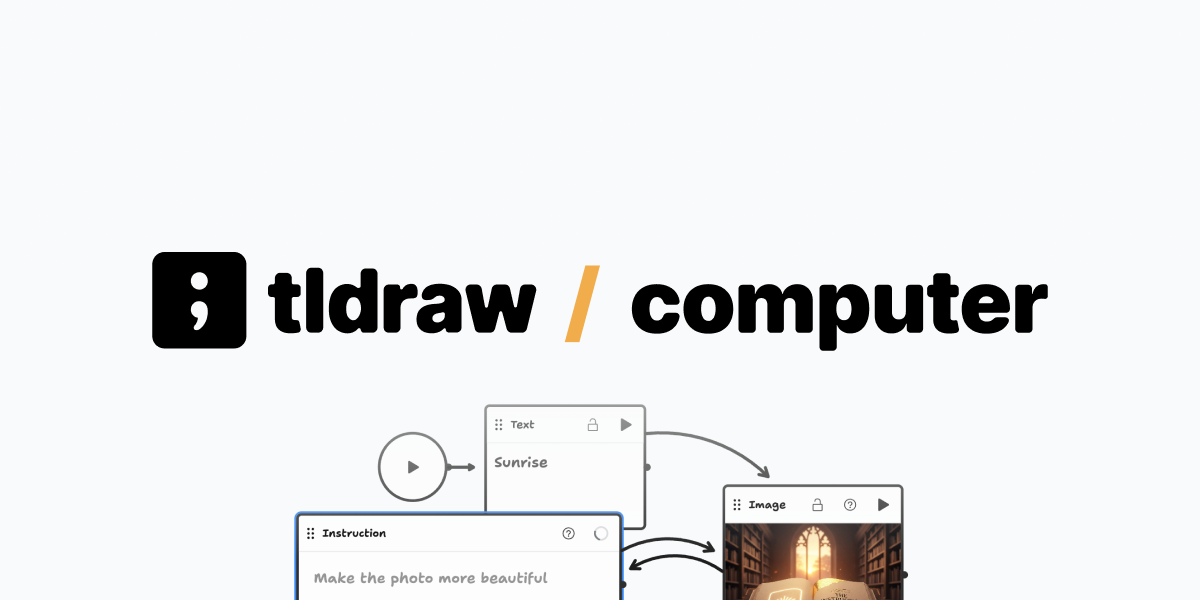
Create visual programs on an infinite canvas. Build interactive components, connect them together, and use AI to power your creations. Free in your browser.

No paid content found
Visit website
Profile views 5 Outbound visits 2 Normal
computer Full homepage screenshot

At a glance

Category
Artificial Intelligence
Language
English
Paid-content signal
No paid content foundObserved
Registered
2021
Hosting
CloudflareInferred
HTTPS certificate trusted
PassedObserved
Last updated

Website review

This review may include AI-generated content and is not individually verified. Domain, certificate and other facts come from the observed data on this page.

What is computer · tldraw?

computer · tldraw is a browser-based tool for building visual programs on an infinite canvas. Instead of writing code in a text editor, you arrange interactive components on a whiteboard-style surface, connect them together, and optionally use AI to power what you create. Its own tagline calls it "visual computing on a canvas," and it runs free in the browser.

H3 What that means in practice The canvas is the workspace and the interface at the same time. Components you place on it can be connected to one another, so the layout itself carries logic — similar in spirit to node-based editors, but presented as an open sketching surface rather than a fixed graph panel. The stated uses are building interactive components and wiring them up, with AI as an optional ingredient rather than a requirement.

H3 Who it suits

  • People who think spatially about logic and would rather sketch a system than describe it in syntax.
  • Educators, workshop leaders or anyone explaining a process to a group, since a canvas is easy to share and annotate live.
  • Prototypers who want a quick interactive mock-up without setting up a development environment.

H3 Trade-offs to weigh Visual canvases are fast for small, exploratory work and read well in presentations, but complex logic can become hard to scan once a diagram grows large, and canvas tools generally offer less precise control than a text-based language. AI assistance speeds up rough ideas but adds unpredictability, so it works best on throwaway experiments rather than anything you need to be exact.

H3 A concrete next step Open the site and try one small thing: place two components, connect them, and see whether the interaction behaves the way you expect. If the mental model clicks within a few minutes, it is worth using for a real prototype; if you find yourself wishing for text-based precision, a conventional programming environment will serve you better.

For a general-purpose whiteboard to pair with this kind of work, tldraw is the main product site.

Do I need to install anything to use computer · tldraw, or does it run entirely in my browser?

It runs entirely in your browser — there is no installation step. You open the site, and the canvas loads in the page itself.

The one practical requirement is JavaScript: the page's own message states you need to enable JavaScript to run tldraw. So "no install" does not mean "no requirements." Your browser must be a current, JavaScript-enabled one, and you should expect a short load before the canvas appears.

What this means in practice

  • Nothing to download or update. No desktop app, no package manager, no account setup implied by the page.
  • JavaScript must be on. If your browser, an extension, or a workplace policy blocks scripts, the canvas will not start.
  • Work happens in a tab. Closing the tab or losing connectivity matters more than it would with an installed app, so check how your work is saved before relying on it for anything long-lived.

A quick test

Open the site in your normal browser. If the canvas loads, you are set. If you only see the JavaScript notice, try a second browser with extensions disabled — that distinguishes a browser-level block from a site problem.

When browser-only is the right call

A browser-only canvas suits quick, exploratory work: sketching a visual program, wiring components together, or trying an idea on a shared or borrowed machine. If you need offline access, local file handling, or long-running sessions you cannot afford to lose, a desktop tool will usually be the safer home for that work.

How do I connect interactive components together to build a visual program?

Interactive components connect through a shared canvas rather than through a fixed pipeline. On computer · tldraw, you place components, wires or handles on an infinite canvas, and the connections you draw define how data or events flow between them. The canvas is the program; the links are the logic.

A practical way to start

  1. Add two components you want to relate — for example, a source that produces a value and a display that shows it.
  2. Look for connection points on each component (edges, ports or handles).
  3. Drag from one component's output point to the other's input point. The canvas draws a visible link.
  4. Run or interact with the source and check whether the second component responds. If nothing happens, the link direction or the port is usually the problem.

What to watch for

  • Direction matters. Most node-based canvases treat one side as input and the other as output. Reversing them often produces a link that looks fine but carries nothing.
  • Types must match. A component expecting a number may ignore a text value. If a connection is accepted visually but has no effect, check what kind of value each port expects.
  • One output, many inputs is usually safe; many outputs into one input often is not, unless the component explicitly merges them.
  • Group related components spatially. On an infinite canvas, layout is not cosmetic — it is how you and anyone else reading the program understand it later.

A concrete scenario

Suppose you want a small interactive demo: a slider that controls the size of a shape, plus a label that reports the current value. Place the slider, the shape and the label near each other. Connect the slider's output to the shape's size input, then connect the same output to the label's value input. Moving the slider now updates both at once, and the two connections make the relationship obvious to anyone who opens the canvas.

Decision criterion

If your program is mostly about what connects to what, a canvas of linked components is a good fit — it keeps structure visible and editable. If it is mostly about long sequences of text-based logic, a canvas will slow you down. For AI-assisted pieces, connect the AI component like any other: feed it an input, take its output, and route that output into whatever consumes it.

What kinds of AI features can I use to power my creations on the canvas?

The AI capabilities on this canvas are framed as a way to power the interactive components you build, not as a separate chatbot bolted onto a whiteboard. The product describes creating visual programs on an infinite canvas, connecting interactive components together, and using AI to power your creations, all free in the browser. That framing suggests the intended use case: you assemble something on the canvas, then let AI drive or enrich part of it.

In practice, that usually means AI sits inside the logic of a component rather than beside it — for example, generating or transforming content that a component then displays, or responding to input from other components you have wired up. Because the canvas is node-based and components can be connected, the interesting work is in the wiring: what feeds the AI, what consumes its output, and where a human stays in the loop.

Who this suits and what to weigh

  • Good fit if you think visually and want to prototype an AI-assisted tool without leaving the browser.
  • Weaker fit if you need a documented, stable AI API surface with guarantees — the page itself gives no detail on model choice, limits, or data handling.
  • The JavaScript requirement means the canvas is a client-side experience; assume your browser does the heavy lifting.

A concrete first test

Build the smallest loop you can: one component that takes text input, one AI step that transforms it, one component that displays the result. If that loop feels natural to assemble and rewire, the canvas approach will scale for you; if you spend most of your time fighting the connections, a conventional code editor will serve you better.

For related canvas-based and visual-AI tooling, Excalidraw is a lighter sketching alternative, and n8n covers node-based automation with AI steps if your goal is orchestration rather than drawing.

Can I use computer · tldraw without paying, and are there any limits?

Yes — you can use computer · tldraw without paying. It runs in your browser, and the page describes it as free, with no pricing tiers, checkout links, or payment platforms shown. There is no paid plan to upgrade to based on the information available.

The practical limit is not cost but capability: the page requires JavaScript to run, so a modern browser with JavaScript enabled is the real gate. Beyond that, the site itself does not list usage caps, storage quotas, or feature restrictions. Any limits you hit would come from your browser, device memory, or how much you put on the canvas rather than from a paywall.

computer · tldraw

A useful next step

Open it in a desktop browser and try one small visual program — drag in a couple of components, connect them, and see how the canvas behaves with your hardware. If you are evaluating it for a team, test whether your intended AI-powered components work in your environment before standardizing on it.

Decision criteria

  • Choose it if you want a free, browser-based canvas for building and connecting interactive components without signing up for a paid tier.
  • Look elsewhere if you need guaranteed storage, collaboration controls, or support commitments, since none are described on the page.
  • Treat "free" as the starting point, not the whole story: confirm that JavaScript-dependent features and AI-powered parts behave as you need on your own machine.

What are some practical things I can build with a node-based editor on an infinite canvas?

A node-based editor on an infinite canvas is best for work where the relationships between parts matter as much as the parts themselves. Instead of writing a single linear script, you place small building blocks, wire them together, and watch data or state flow through the graph. The canvas gives you room to arrange the whole system spatially, so you can zoom out to see structure and zoom in to inspect one component.

Practical projects tend to fall into a few buckets:

  • Interactive dashboards — a data source node feeding filter, aggregate and chart nodes. Change one parameter and the downstream visuals update.
  • Simulations and small games — timers, counters, collision or scoring logic wired into a loop you can pause and inspect mid-run.
  • AI-assisted tools — a prompt or input node connected to a model call, with parsing and display nodes downstream. Useful for prototypes where you want to swap one step without rewriting the pipeline.
  • Automation sketches — form input, validation and branching logic laid out as a flow you can explain to someone else.
  • Teaching material — a graph is a diagram that actually runs, which makes abstract concepts like recursion or state machines easier to demonstrate.

The trade-off is real. Node graphs are excellent for prototyping and for showing how something works, but they can become hard to read once a project grows large, and they are usually weaker than text-based code for version control, testing and fine-grained refactoring. If your project is mostly sequential logic with few branches, a script may serve you better.

A good next step: pick one small task you already understand well — say, a temperature converter or a simple scoring rule — and rebuild it as a graph. If the wiring clarifies the logic, the canvas is a good fit for your larger idea. If it just adds clicking, keep it in code.

For a browser-based canvas environment built around this style of visual computing, see computer · tldraw.

Related questions

More questions →
What Is Visual Programming and How Does Canvas-Based Programming Work?

Visual programming means building a program by placing and connecting visual elements instead of typing lines of code. On a canvas-based tool like tldraw's computer, you place components on an infinite canvas, wire them together, and optionally add AI to power behavior. This approach suits interactive, spatial, and exploratory work — dashboards, prototypes, teaching demos — better than it suits large, logic-heavy codebases.

Visual programming vs. text-based coding

The core difference is the interface, not the underlying computation. Both describe inputs, operations, and outputs; they just express them differently.

Dimension Text-based coding Visual programming
Primary input Keyboard, typed syntax Mouse/touch, drag-and-drop
Structure Files, functions, classes Nodes/components and connections
Reading a program Top-to-bottom text flow Spatial layout on a canvas
Best for Complex logic, version control, large teams Prototypes, interactive UI, teaching, exploration
Failure mode Syntax errors, type errors Miswired or disconnected components

Text code scales through abstraction (functions, modules). Visual programs scale through layout and composition — which is why they shine when the relationships between parts matter more than the raw logic.

The node-and-connection model on an infinite canvas

A canvas-based visual program has three ingredients:

  1. Components (nodes) — self-contained units that take an input and produce an output. A slider, a data fetch, a chart, or a text box can each be a component.
  2. Connections (edges) — the wires that pass one component's output into another's input. The connection is the data flow.
  3. The canvas — an unbounded surface where you arrange components spatially. Position carries meaning: related parts sit together, and you can zoom out to see the whole system.

The mental model is a pipeline. If component A outputs a number and component B expects a number, connecting A → B makes B react whenever A changes. Disconnect the wire and the flow stops. This is why the most common bug in visual programming isn't a syntax error — it's a missing or misplaced connection.

An infinite canvas matters because visual programs grow sideways, not downward. You can keep a working section intact while experimenting in empty space beside it, then wire the successful experiment back in.

Building and linking interactive components

A typical build loop looks like this:

  1. Place a source component — something that produces a value, such as a slider, a text input, or a data source.
  2. Place a transform component — something that changes the value, such as a calculation or a filter.
  3. Place an output component — something that displays or acts on the result, such as a chart, a shape, or an animation.
  4. Connect them in order — source → transform → output.
  5. Interact and verify — move the slider and confirm the output updates. If nothing changes, check the connection first.

The expected result is a live, interactive artifact: change an input on the canvas and the downstream components respond immediately. That immediacy is the main advantage — you see the effect of a change without a build step.

Where AI fits in

AI enters a visual programming workflow in two practical places:

  • As a component — an AI step that takes a prompt or data as input and returns generated content, which you then wire into the rest of the canvas like any other node.
  • As a builder — using natural-language instructions to generate or modify components, so you describe the behavior you want instead of assembling every node by hand.

In both cases the canvas stays the source of truth: AI output becomes just another value flowing through connections you control. Treat AI-generated components as drafts to inspect and rewire, not as finished logic.

When to choose visual programming

Choose visual programming when:

  • The problem is spatial or interactive (dashboards, simulations, teaching tools).
  • You want to explore and iterate quickly without a compile cycle.
  • Non-programmers need to read or modify the logic.
  • The system is a pipeline of inputs, transforms, and outputs.

Choose text-based coding when:

  • The logic is deeply nested or algorithmically complex.
  • You need rigorous version control, testing, and code review.
  • The program is large and maintained by many people over time.
  • Performance and precise control matter more than visual clarity.

Many real projects mix both: a visual canvas for the interactive layer, text code for the heavy computation behind it.

Getting started

tldraw's computer runs in the browser and requires JavaScript enabled to load. Open the canvas, place a source component, connect it to an output, and interact with it — that single working pipeline teaches the model faster than any description. From there, add a transform in the middle, then an AI component, and watch how each new connection changes the behavior of the whole.

What Is a Node-Based Editor and How Does It Work?

A node-based editor is a visual programming interface where you build a program by placing nodes (each representing an operation, value, or component) on a canvas and connecting them with wires. Data or control flows along those wires from one node's output port to another node's input port, and the resulting graph is what executes. It suits people who think in terms of data flow and relationships rather than sequential lines of text — for example, building interactive components, wiring up AI steps, or prototyping logic on an infinite canvas. It is less suited to problems dominated by tight loops, heavy string manipulation, or large codebases where text tooling (diffing, refactoring, search) matters more.

The core building blocks

Every node-based editor, regardless of product, is made of the same few parts:

Element What it is What it does
Node A box on the canvas Represents one operation, value, or component
Port A labeled socket on a node Input ports receive data; output ports emit it
Wire / edge A line between two ports Carries data or control from an output to an input
Graph The whole set of nodes and wires Is the program itself
Parameter / property A field inside a node Configures that node's behavior (a constant, a setting, a mode)

The key mental shift: in text code, order is implied by line position. In a node graph, order is implied by connections. A node with no incoming wire on a required port simply has nothing to run on.

How execution actually happens

There are two common models, and knowing which one you're in explains most confusing behavior:

  • Data-flow (push) execution. When a node's inputs are all satisfied, it runs and pushes its result downstream. This is the model in most visual-programming and shader-style tools. Change one upstream value and everything downstream recomputes.
  • Pull / on-demand evaluation. Nothing runs until something downstream asks for a value; the editor walks backward up the graph to compute only what's needed. This is common when the graph feeds a render or a query.

Triggering is usually one of: automatic re-run on any change, an explicit "run" action, or an event (a click, a timer, an input change) wired into the graph as a source node.

Node-based editor vs. related approaches

These are often confused, so compare them on the same axes:

Approach How you express logic Best when Weak when
Node-based editor Nodes + wires (a graph) Data flow is the point; you want to see structure Logic is deeply nested or loop-heavy
Text code Statements in a file Precise control, large systems, version control You mainly need to see relationships
Block-based programming Stacked blocks (snap together) Teaching sequencing and control flow You need branching data pipelines
Canvas visual programming Freeform components on an infinite canvas Spatial, interactive, mixed media You need a strict typed pipeline

A node-based editor is often implemented on a canvas — the canvas is the surface, the node graph is the structure. So "canvas computing" and "node-based editing" overlap but aren't identical: a canvas can hold non-node elements (freehand drawings, images, text) alongside a graph.

Typical workflow

  1. Add nodes. Place a source node (a constant, an input, a data fetch) and the operation nodes you need.
  2. Connect ports. Drag from an output port to a compatible input port. The editor usually highlights valid targets.
  3. Configure parameters. Fill in the fields inside each node — values, modes, options.
  4. Run. Either it auto-runs on change, or you trigger execution.
  5. Inspect the result. Check the output node, a preview, or a connected display component.
  6. Iterate. Change a parameter or rewire, and watch what updates.

Troubleshooting the common failures

  • Type mismatch on a wire. The output port produces a different kind of value than the input expects (e.g., a list into a single-value port). Fix: insert a conversion node, or pick the matching port.
  • Cycle / circular dependency. Node A feeds B which feeds back into A. Most editors refuse to run this. Fix: break the loop with a state or delay node, or restructure.
  • Node produces no output. Usually an unsatisfied required input, an unset parameter, or an upstream node that itself failed. Trace backward from the silent node to the first one missing input.
  • Nothing updates when you change something. You may be in pull mode without a trigger, or the changed node isn't on the path to the output. Check whether a re-run is needed.

Choosing whether to use one

Pick a node-based editor when the problem is naturally a graph of transformations — inputs flowing through steps to an output — and when seeing that structure helps you reason. Skip it when the logic is dominated by iteration, complex conditionals, or text-heavy processing, where a text editor's tooling will serve you better. Many tools let you mix both, using nodes for the visible pipeline and small code blocks for the fiddly parts.

What Is an AI Whiteboard and How Do You Use AI on a Canvas?

An AI whiteboard is a digital canvas where AI can generate, edit, or organize visual content alongside your own drawing and diagramming. You use it when the bottleneck is turning rough ideas into structured visuals — not when you already know exactly what to draw. On tldraw's computer (computer.tldraw.com), the canvas is built for visual programming: you place interactive components, connect them, and use AI to power what you build. The site describes it as free in your browser, and it requires JavaScript to run.

How an AI whiteboard differs from a standard digital whiteboard

A standard whiteboard is a surface: you draw, type, and move things, and every change comes from you. An AI whiteboard adds a layer that can act on the content already on the canvas.

Dimension Standard digital whiteboard AI whiteboard
Who creates content You, entirely You plus AI-generated or AI-edited elements
Input types Drawing, text, shapes, images Same, plus prompts that produce or transform canvas objects
Output Static board you interpret Board that can hold interactive components and generated structure
Main use Capture and arrange ideas Capture, then convert ideas into diagrams, summaries, or working visuals
Editing model You edit every element You edit AI output like any other canvas object

The practical difference is where the effort goes. On a standard board you spend time drawing structure. On an AI whiteboard you spend more time specifying what you want and then correcting the result.

Common AI actions on a canvas

These are the tasks AI features on a canvas are typically pointed at. Treat them as categories of work rather than a fixed menu — what's available depends on the tool.

  • Generate diagrams. Describe a system, flow, or relationship and get shapes and connectors placed on the canvas instead of drawing each box yourself.
  • Summarize notes. Turn a cluster of sticky notes or text blocks into a shorter set of points on the board.
  • Turn text into shapes. Convert a written list into nodes, cards, or a structured layout you can then rearrange.
  • Clean up messy boards. Align, group, or reorganize scattered elements into something readable.

On tldraw's computer specifically, the emphasis is on building interactive components and connecting them, with AI used to power those creations. That's a step beyond generating a static diagram: the canvas holds things that do something.

How AI fits into a visual workflow

AI works best as a middle step, not the first or last one.

  1. Dump raw material. Sketch, type, or paste everything onto the canvas without worrying about order. This is the part humans are good at and AI can't do for you.
  2. Ask AI to impose structure. Generate a diagram from a description, convert notes into nodes, or propose a grouping. The output lands as editable canvas objects.
  3. Edit by hand. Move, rename, delete, and reconnect. AI output is a first draft, and the canvas is where you fix it.
  4. Connect and extend. If the tool supports interactive components, wire them together so the board does something rather than just showing something.
  5. Iterate. Re-prompt on the parts that are wrong instead of rebuilding from scratch.

The manual steps aren't overhead — they're where the board becomes accurate.

Typical use cases

  • Brainstorming. Generate a spread of ideas or categories from a short prompt, then prune by hand.
  • System mapping. Describe components and dependencies, get a first-pass diagram, then correct the relationships.
  • Turning rough sketches into structured diagrams. Sketch loosely, then have AI or structured tools convert the mess into aligned nodes and connectors.
  • Prototyping interactive visuals. On a canvas built for visual programming, assemble components and connect them, using AI to drive behavior.

Limits to expect

  • Accuracy. Generated diagrams can contain wrong relationships or invented details. Verify anything factual before you rely on it.
  • Editing is mandatory. AI output rarely matches your intent on the first pass. Budget time for cleanup.
  • Manual work is sometimes faster. For a five-box flowchart you already have in your head, drawing it beats writing a prompt and fixing the result.
  • Tool-dependent features. Not every AI whiteboard supports interactive components or visual programming. tldraw's computer is aimed at that use; a general AI whiteboard may only generate and summarize.
  • Browser and JavaScript requirements. tldraw's computer needs JavaScript enabled to run, so it won't work in a stripped-down or script-blocked browser.

Choosing whether to use one

Use an AI whiteboard when the hard part is structuring vague input — messy notes, an undescribed system, a rough sketch. Stay with a plain whiteboard or direct drawing when you already know the structure and just need to place it. If you want the canvas to hold working, connected components rather than static diagrams, look for a tool built for visual programming, which is the direction tldraw's computer takes.

What Is Canvas Computing and How Do You Build Visual Programs on a Canvas?

Canvas computing means building a program by placing interactive components on an infinite canvas and connecting them, rather than writing code line by line. On tldraw's computer (computer.tldraw.com), you get a visual programming surface in the browser: components act as nodes, connections carry data or control flow, and AI can help power what you build. It's a good fit when you want to prototype interactive behavior, teach programming concepts, or assemble small tools without a full development setup. It is not a replacement for a conventional codebase when you need fine-grained control, version control, or heavy computation.

The core idea: a canvas instead of a file

In a text editor, a program is a sequence of statements read top to bottom. On a canvas, a program is a spatial arrangement: each component sits somewhere on an infinite plane, and the meaning comes from what it is and what it connects to.

This changes three things:

  • Structure is visible. Data flow is a line you can trace with your eyes, not a call stack you reconstruct in your head.
  • Editing is direct. You move, duplicate, or rewire a component instead of renaming variables across files.
  • The canvas is the workspace. Notes, dead ends, and alternative versions can live next to the working program without polluting it.

How the node-based editor model works

The node-based editor is the mechanism underneath. Three parts matter:

Components as nodes

Each component is a self-contained unit with inputs, outputs, and some behavior — a slider, a shape, a text box, a logic gate, an AI-powered block. A node doesn't know or care what feeds it; it just reacts to its inputs.

Connections as data or control flow

A connection between two nodes means "output of A becomes input of B." That single rule covers most cases:

Connection type What it carries Example
Data flow A value A slider's number drives a shape's size
Control flow An event or trigger A button click starts an animation
Reference A shared object Two components read the same text

Evaluation

When an input changes, the affected nodes recompute and the result updates on the canvas. You see the effect immediately, which is why this model suits interactive and exploratory work.

How visual programming differs from traditional coding

Dimension Traditional coding Canvas computing
Setup Install a runtime, editor, dependencies Open a browser page
Reading a program Follow files and function calls Trace lines between visible components
Debugging Breakpoints, logs, stack traces Inspect a node's inputs and outputs in place
Reuse Import modules, copy functions Duplicate a component or a connected cluster
Best for Large systems, precise control Prototypes, interactive pieces, learning

The trade-off is real: visual programs are easier to see and harder to scale. Past a certain complexity, a canvas of hundreds of nodes becomes as hard to navigate as a large codebase — just in a different way.

Where AI fits in

AI on a canvas can act as a node like any other: you feed it input, it produces output, and that output flows into the rest of the program. Practically, this means you can:

  • Generate content (text, shapes, images) that other components then manipulate.
  • Turn a natural-language description into a starting arrangement of components.
  • Add behavior to a component without writing the logic yourself.

Because AI output is just another value on the canvas, you can inspect it, branch on it, or feed it back into the graph — the same as any other node.

A concrete first project

A minimal build that exercises the whole model:

  1. Open the canvas at computer.tldraw.com in a browser with JavaScript enabled.
  2. Add an input component — for example, a slider or a text field. This is your source node.
  3. Add an output component — a shape, a label, or a display block.
  4. Connect them. Drag from the input's output to the output component's input. The connection line is the program.
  5. Change the input. Move the slider or edit the text. The output component should update immediately — that's the evaluation loop working.
  6. Add a third component between them (a transform, a condition, or an AI block) and rewire. You've just built a three-node pipeline.

Verification: if changing the input doesn't change the output, the connection isn't carrying data — check that you connected output-to-input, not input-to-input.

Common limitations to plan around

  • JavaScript is required. The page states you need JavaScript enabled to run tldraw. With it disabled, nothing loads.
  • Browser performance. An infinite canvas with many live components runs in a browser tab, so very large or compute-heavy graphs will feel the limits of that environment.
  • Complexity ceiling. As noted above, visual clarity degrades as node count grows; plan to split large ideas into separate canvases rather than one giant graph.
  • Not a code replacement. For version control, testing, and precise performance work, a text-based codebase remains the better tool.

When to choose canvas computing

Pick it when the problem is interactive, visual, or exploratory — a prototype, a teaching demo, a small tool, or a sketch of an idea you'll later formalize. Skip it when you need strict reproducibility, deep integration with existing code, or performance you can measure and tune at a low level.

What Are Interactive Components and How Do You Build Them on a Canvas?

Interactive components are the reusable building blocks of a canvas-based visual program: self-contained pieces you place on an infinite canvas, configure, and wire together so they respond to input and pass data or trigger behavior. On tldraw's computer (computer.tldraw.com), you build them visually rather than by writing a full application, and the site describes the workflow as creating visual programs, connecting components, and using AI to power what you make. The main condition to know up front: the tool runs in the browser and requires JavaScript to be enabled, so a page that stays blank usually means scripting is blocked rather than the canvas being empty.

Static shapes vs. interactive components

The distinction matters because both live on the same canvas and look similar at a glance.

Static shape Interactive component
Responds to input No Yes
Holds state or logic No Yes
Can be connected to others Rarely meaningful Designed for it
Role in a program Annotation, layout, reference Functional unit of the program

A drawn rectangle is a shape. A component that reads a value, changes when you interact with it, or feeds another component is part of the program's behavior. If nothing on your canvas reacts when you click, drag, or change a value, you are most likely working with static shapes rather than components.

How components are placed, configured, and connected

The general pattern in canvas-based visual programming, and the one the site's description points to, is:

  1. Place a component on the canvas. It becomes an object with its own position and identity.
  2. Configure it. Components expose settings or inputs that determine what they do — a source of data, a condition, a display format.
  3. Connect it. Wiring one component's output to another's input is what turns a collection of parts into a working program.
  4. Run and observe. Because the canvas is live, you see the result of the connections rather than compiling and launching separately.

The connection step is the one that carries the most meaning. A wire is a claim that "this output feeds that input," so a program that does nothing is often a program whose wires are missing, reversed, or pointing at the wrong port.

Wiring components to pass data or trigger behavior

Two broad kinds of connection show up in node-based editors, and it helps to know which one you are making:

  • Data flow — a value produced by one component becomes the input of another. Change the source and everything downstream updates.
  • Trigger or event flow — one component's action causes another to run. The connection carries "when this happens, do that" rather than a value.

If a component receives data but never appears to act, check whether you wired a data connection where a trigger was needed, or the reverse. They are not interchangeable.

Where AI fits

The site lists AI as a way to power your creations, which in practice means AI can generate or drive component behavior instead of you specifying every rule by hand. Treat this as an accelerator for the parts that are tedious to encode manually, and keep the deterministic wiring — what connects to what — under your own control so you can still reason about why the program behaves as it does.

When components don't respond

Work through these in order, since each rules out a different layer:

  • Blank canvas or nothing loads — JavaScript is disabled or blocked. The site states plainly that JavaScript must be enabled to run tldraw.
  • The component renders but ignores clicks — you may have a static shape, not an interactive component.
  • It reacts but nothing downstream changes — the output is not wired to the next component's input, or the wire is on the wrong port.
  • It worked, then stopped — an upstream value or trigger changed. Trace back along the connections to the first component that no longer produces what the rest expect.
  • Behavior is unpredictable — too much logic is hidden inside AI-driven parts. Move the connection structure back into explicit wiring so each step is inspectable.

The reliable habit is to test one connection at a time: place two components, wire them, confirm the second responds to the first, then add the next. Debugging a canvas is much easier when you know which wire introduced the problem.

Website Overview

The available information shows a mix of normal operation and configuration gaps. Depending on how the website is used, these gaps may affect secure access or the consistency of its public presentation.

Domain and Registration

Transfer-protection status is present, helping reduce the risk of unauthorized domain transfers. The domain has about 5 years of registration history; its current configuration provides more context than age alone. The domain uses the common .com extension, which is not an independent safety signal.

DNS and Email

The lowest TTL is 60 seconds, supporting rapid record changes at the cost of more frequent lookups. Nameservers are provided by vercel-dns.com, indicating managed DNS hosting. DNS and provider evidence indicate traffic passes through the Cloudflare CDN, which may support caching and traffic distribution. MX records point to the Google Workspace email service. CAA records restrict which certificate authorities are authorized to issue certificates.

TLS and Certificates

The public key uses EC with 256 bits. The server supplied a complete certificate chain. No organization name is present in the certificate; the available fields are consistent with domain validation. The certificate was issued by Let's Encrypt, commonly associated with automated certificate services. The certificate's total validity is about 89 days, consistent with a short renewal cycle.

HTTP and Browser Security

The checked browser-security headers were not detected, leaving fewer explicit browser-side safeguards. No X-Powered-By header was found, reducing one common source of backend fingerprinting information. The cf-ray response header indicates a CDN or caching proxy in the delivery path. No obvious internal addresses or debug information were found in the headers. The Server header identifies cloudflare without an exact version.

Technology Stack Analysis

The public page identifies Cloudflare without precise versions, leaving fewer clues for version-specific scanning.

Search and Social Sharing

No homepage canonical URL was detected. If duplicate URLs exist, consolidation may be less explicit. Twitter Card metadata is configured. The title has 48 characters, within a common display range. A meta description is present, with 156 characters. The observed directives allow indexing and link following.

Hosting and Email

DNSvercel-dns.com
HostingCloudflare
EmailGoogle Workspace
Approximate IP geolocation (inferred; a CDN or proxy may differ from the origin server) United States flagUnited States Inferred 2606:4700::6812:c1f

Registration details

RDAP / WHOIS

RegistrarName.com, Inc.
Registered2021-02-13
Expires2027-02-13
Domain statusclient transfer prohibited
Nameserversns1.vercel-dns.com、ns2.vercel-dns.com
DNSSECunsigned

DNS records

DNS

TypeNameValueTTLPriority
Acomputer.tldraw.com.cdn.cloudflare.net104.18.12.31300—
Acomputer.tldraw.com.cdn.cloudflare.net104.18.13.31300—
AAAAcomputer.tldraw.com.cdn.cloudflare.net2606:4700::6812:c1f300—
AAAAcomputer.tldraw.com.cdn.cloudflare.net2606:4700::6812:d1f300—
MXtldraw.comaspmx.l.google.com601
MXtldraw.comalt1.aspmx.l.google.com605
MXtldraw.comalt2.aspmx.l.google.com605
MXtldraw.comalt3.aspmx.l.google.com6010
MXtldraw.comalt4.aspmx.l.google.com6010
NStldraw.comns1.vercel-dns.com86400—
NStldraw.comns2.vercel-dns.com86400—
TXTtldraw.comgoogle-site-verification=C0aCqwtoGEFEie7awDx8VWf2TvDNprDWKO-BWFoxEWI60—
TXTtldraw.comgoogle-site-verification=CVW6azfEL8YHva0m6LLn-SjPTLt5iTfsOSnS4880jkc60—
TXTtldraw.comgoogle-site-verification=aelRjHTr82Ix2egjDtPubAyCSFEV5UlaOKp5PLNsYi460—
TXTtldraw.comgoogle-site-verification=woNelvy_ec8QeylCtYBYGNHHSM7TmuiDbmvW9saYc4M60—
TXTtldraw.comv=spf1 include:_spf.google.com include:145620695.spf06.hubspotemail.net include:clkmail.tldraw.com -all60—
CNAMEcomputer.tldraw.comcomputer.tldraw.com.cdn.cloudflare.net60—
CAAtldraw.com0 issue "letsencrypt.org"60—
CAAtldraw.com0 issue "pki.goog"60—
CAAtldraw.com0 issue "sectigo.com"60—
DMARC_dmarc.tldraw.comv=DMARC1; p=none;60—

TLS and certificates

TLS / SSL

AssessmentNormal configuration
Supported protocolsTLSv1.2、TLSv1.3
Negotiated protocolTLSv1.3
Certificate subjectcomputer.tldraw.com
IssuerLet's Encrypt
Valid until2026-11-29T22:32 · Remaining when checked: 55 days
Verification detailsCertificate trust: Passed · Hostname match: Passed

HTTP response headers

HTTP

HeaderValue
content-typetext/html
cache-controlpublic, max-age=0, must-revalidate
servercloudflare

Identified technologies

Cloudflare

Pages, Search and Sharing

Meta descriptionCreate visual programs on an infinite canvas. Build interactive components, connect them together, and use AI to power your creations. Free in your browser.
Canonical URLNot detected
LanguageEnglish (default)
Twitter Cardsummary_large_image

Unknown

No sitemaps found

User reviews (0)

  • No reviews yet.