
 简体中文
简体中文 English
Website review
This review may include AI-generated content and is not individually verified. Domain, certificate and other facts come from the observed data on this page.
What is Better Analyst?
Better Analyst (formerly Formula Bot) is an all-in-one analytics app for individuals and small, growing businesses. Its pitch is that you can do the work of an analyst without learning SQL, Python, or a separate business intelligence platform — data enrichment, insights, dashboards, and automation live in one place rather than being stitched together from several tools.
What it covers
- Data enrichment — cleaning up and adding context to the data you already have.
- Insight discovery — finding patterns and answers without writing queries.
- Dashboards — the site emphasises building them "in seconds with AI," aimed at people who want presentable reporting quickly.
- Automation — recurring analytics work can be set up to run on its own, which matters most for weekly or monthly reporting cycles.
Who it suits
The clearest fit is a solo operator, marketer, or small-team lead who owns the numbers but isn't a data specialist. If your current workflow is exporting CSVs into a spreadsheet and rebuilding the same charts every month, this is the problem it targets. It's less obviously aimed at teams with an existing warehouse and BI stack, or analysts who need fine-grained control over modelling.
A practical next step
Pick one recurring report you rebuild by hand — a monthly revenue or campaign summary — and test whether Better Analyst can produce it end to end, including the refresh. That single test tells you more than a feature tour: if the dashboard comes together quickly but the automation or data connection needs manual work each cycle, you've found where the real effort sits.
Privacy and security are called out as a focus on the page, but the specifics of how data is handled aren't detailed here, so check those terms directly if you'd be feeding in customer data.
How is Better Analyst different from Formula Bot?
Better Analyst is the current name for the product formerly called Formula Bot. The page presents it as the same all-in-one analytics app, now positioned around the full analytics workflow rather than a single utility.
H3 What changed in practice The old Formula Bot identity suggested a focused tool for spreadsheet-style formula help. The Better Analyst framing covers a broader set of jobs: enriching data, finding insights, building dashboards, and automating recurring work. The page also states that individuals can do analyst-level work without learning SQL, Python, or a separate business intelligence platform.
That matters if your starting point is a spreadsheet and a question, not a data stack. A small-business owner tracking sales by region, for example, could clean and enrich a CSV, generate a dashboard, and repeat the same analysis monthly without writing queries.
H3 How to decide
- If you only need occasional formula assistance, a lightweight spreadsheet add-on may still be enough.
- If you want one place to handle data prep, dashboards, and recurring reporting, the broader Better Analyst scope is the relevant shift.
- If you already run a dedicated BI tool and a data team, compare the automation and dashboard features against your existing setup rather than the name change.
The practical next step is to open the app and test one real recurring report end to end: import your data, build the dashboard, and see whether the automation saves meaningful time.
Can I use Better Analyst without knowing SQL or Python?
Yes. Better Analyst is explicitly positioned for people who don't want to learn SQL, Python or a traditional BI platform — its page states you can "do the work of an analyst without learning SQL, Python, or another business intelligence platform." It also describes bringing the whole analytics workflow into one app, including data enrichment, insights, dashboards and automation.
H3 What that looks like in practice
- You load or connect your data and work through a guided interface rather than writing queries.
- Dashboards are described as buildable "in seconds with AI," so chart and layout work leans on generated suggestions.
- Recurring tasks can be automated, which suits weekly reporting or repeated data refreshes.
H3 Where you may still need technical help
- Data preparation: if your source files are messy, inconsistent or spread across systems, someone usually has to define how they join and what counts as a valid record.
- Metric definitions: software can generate a chart quickly, but deciding that "active customer" means one thing and not another is a business judgement, not a coding one.
- Scale and governance: as a team grows, access control, data privacy and security expectations get stricter. The product page lists data privacy and security as a concern, but you should check how it handles your specific requirements before putting sensitive data in.
H3 A useful test before committing Pick one real report you currently produce by hand. Try to reproduce it end to end in Better Analyst, including the refresh. If you can do that without touching SQL or Python, the tool fits your level. If you get stuck at the joining or cleaning step, that is the gap to solve first — either by tidying the source data or by involving someone technical for setup only.
For comparison, spreadsheet-first tools such as Google Sheets or Microsoft Excel handle small, clean datasets without any query language, while code-based notebooks like Jupyter remain the fallback when logic gets genuinely custom. Better Analyst's pitch is the middle ground: more automation than a spreadsheet, less syntax than a notebook.
How does Better Analyst help me create dashboards with AI?
Better Analyst helps you create dashboards with AI by generating them from your data rather than making you hand-build charts and layouts. According to the product page, the workflow is positioned as “build beautiful dashboards in seconds with AI,” and the broader pitch is that you can “do the work of an analyst without learning SQL, Python, or another business intelligence platform.” In practice, that means you connect or upload data, describe the dashboard you want, and let the AI propose the charts, metrics, and arrangement — then you refine it.
What the AI dashboard workflow looks like
The page groups dashboard building into a single analytics app that also covers data enrichment, insight discovery, and automation. The dashboard step is the visual output layer.
- Bring in your data. The app is aimed at individuals and growing businesses, so the expected input is ordinary business data — spreadsheets, exports, or connected sources — not a warehouse you have to model first.
- Ask for a dashboard in plain language. Because the product is pitched at people who don't want to learn SQL, Python, or a traditional BI platform, the AI is meant to interpret a description of what you want to see.
- Get a draft dashboard. The AI produces charts and a layout, which is the “in seconds” part of the claim.
- Refine and reuse. The same app handles recurring work and automation, so a dashboard you like can become something that refreshes rather than something you rebuild each week.
When this is a good fit
The AI-dashboard approach suits you if:
- You are a founder, operator, or solo analyst who needs answers this week, not a BI rollout next quarter.
- Your data lives in spreadsheets or simple business tools rather than a governed data warehouse.
- You want a first draft fast and are comfortable adjusting it, rather than specifying every axis and filter yourself.
It is a weaker fit if you need pixel-perfect, heavily governed reporting with strict metric definitions, or if your organization already standardizes on a full BI platform and expects dashboards to live there.
A concrete scenario
Say you run a small e-commerce business and want a weekly view of revenue by channel, top products, and repeat-purchase rate. Instead of writing SQL against an export, you load the order data, describe those three views, and get a draft dashboard. You then fix labels, drop a chart that isn't useful, and set it to refresh — which is the recurring-work part the page emphasizes.
How to decide
Start with one real question you currently answer by hand in a spreadsheet, and try to produce that as a dashboard. If the AI draft is close enough that you only need small edits, the tool fits your workflow. If you spend more time correcting the AI than building the chart yourself, your data or your reporting needs are probably more structured than this approach assumes.
For a fuller picture of the workflow and privacy details, see Better Analyst.
Is my data private and secure with Better Analyst?
Better Analyst states that data privacy and security are part of the product, and its page lists “Data privacy and security” as a dedicated topic. Beyond confirming that privacy and security are treated as first-class concerns, the public page information does not spell out the specific safeguards, certifications, or retention practices, so you should verify those details directly before uploading sensitive data.
As practical advice, treat any analytics tool as a place where your data leaves your direct control. Before importing customer lists, financials, or personal information, check:
- Where data is stored and processed, and whether that matches your legal or contractual requirements.
- Whether data is encrypted in transit and at rest, and who can access it internally.
- What happens to your data if you stop using the service, including export and deletion.
- Whether the tool uses your data to train models or improve the service, and whether you can opt out.
A concrete scenario: a small business owner wants to enrich a customer spreadsheet and build a dashboard. The workflow is convenient, but if the spreadsheet contains names, emails, or payment details, the owner should confirm the provider’s data-processing terms and any available data-processing agreement before uploading. For anonymized or aggregate sales figures, the risk is lower and the tool’s speed advantage matters more.
If privacy is a deciding factor, start by reviewing the vendor’s official privacy and security documentation at Better Analyst, then compare it with your own obligations.
Can I start using Better Analyst on my own and scale as my business grows?
Yes. Better Analyst is explicitly positioned for that path: its page says to “start on your own” and keep using it as you grow, and it describes the audience as individuals and growing businesses. The individual pitch is that you can do analyst-style work without learning SQL, Python, or another business intelligence platform.
What that looks like in practice
You can begin with one dataset and one question, then add more as the business adds complexity. The workflow is presented as one app covering the whole analytics process: enriching data, finding insights, building dashboards, and automating recurring work. That means your first dashboard can be a simple recurring report, and later the same setup can support more data sources and scheduled updates without switching tools.
Where it fits — and where it may not
| Stage | Good fit | Trade-off to consider |
|---|---|---|
| Solo or very small team | No-code analysis, quick dashboards, recurring automation | Less need for the control and customization of a full BI platform |
| Growing business | Same app scales with more data and more recurring work | You may eventually want deeper data-modeling or governance features |
| Larger or highly regulated teams | Data privacy and security are addressed on the page | Confirm the specific controls your industry requires before committing |
A useful next step
Pick one recurring report you currently build by hand — a weekly sales summary, for example. Run that single workflow in Better Analyst first. If it saves time and the output is trustworthy, expand to a second dataset or a scheduled automation. That gives you a low-risk way to test whether the tool grows with you before you standardize on it.
 Namecheap
 Cloudflare
 Google Workspace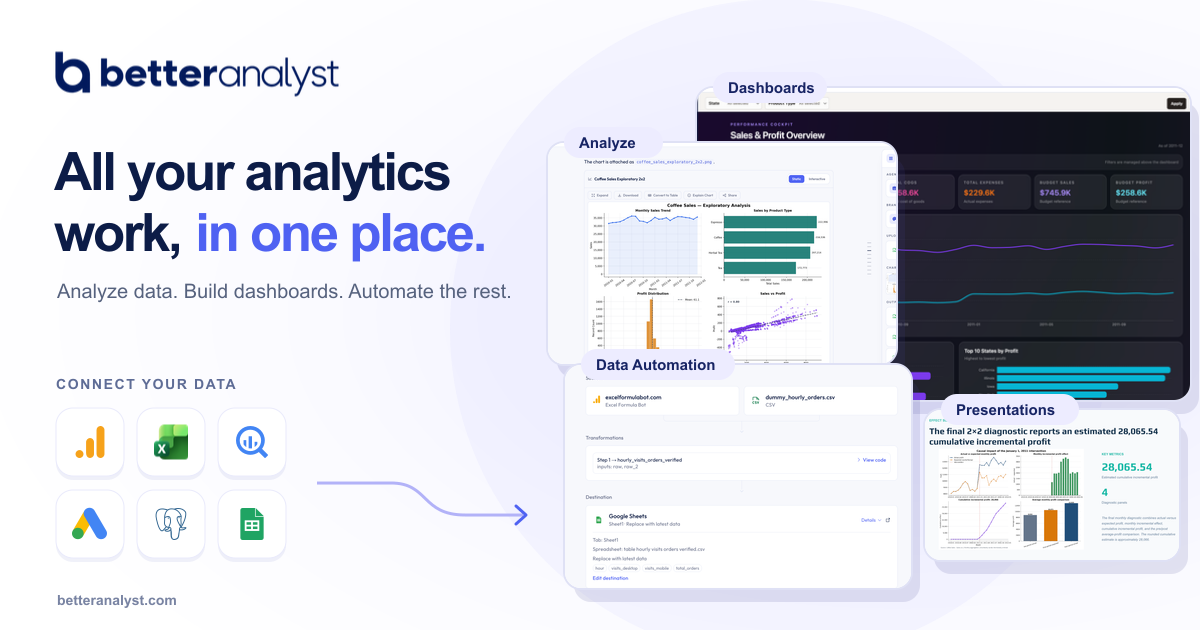

User reviews (0)