Website profiles · Technology insights · Alternatives

deepnote.com Paid content

Categories: Data & Analytics

Explore data with Python & SQL, work together with your team, and share insights that lead to action — all in one place with Deepnote.

Visit website

Updated: 2026-10-01 02:56 Language: English (default) Access: Normal

Profile views 4 Outbound visits 0
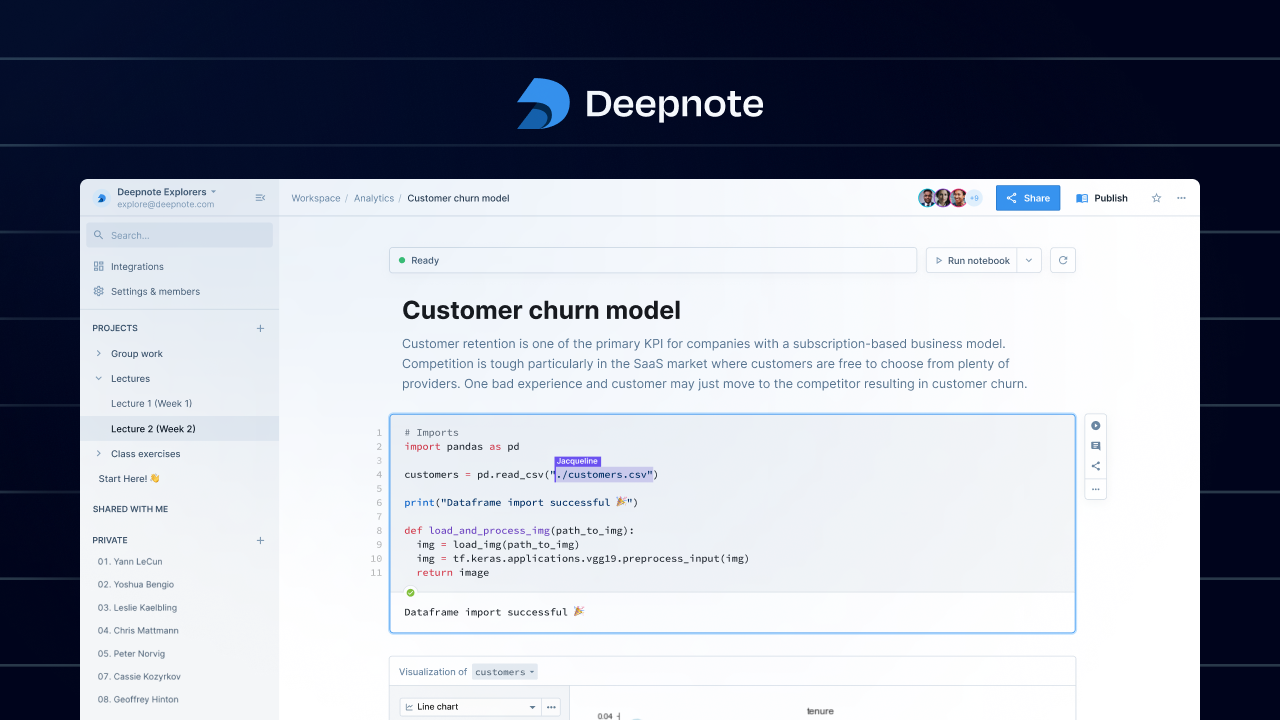
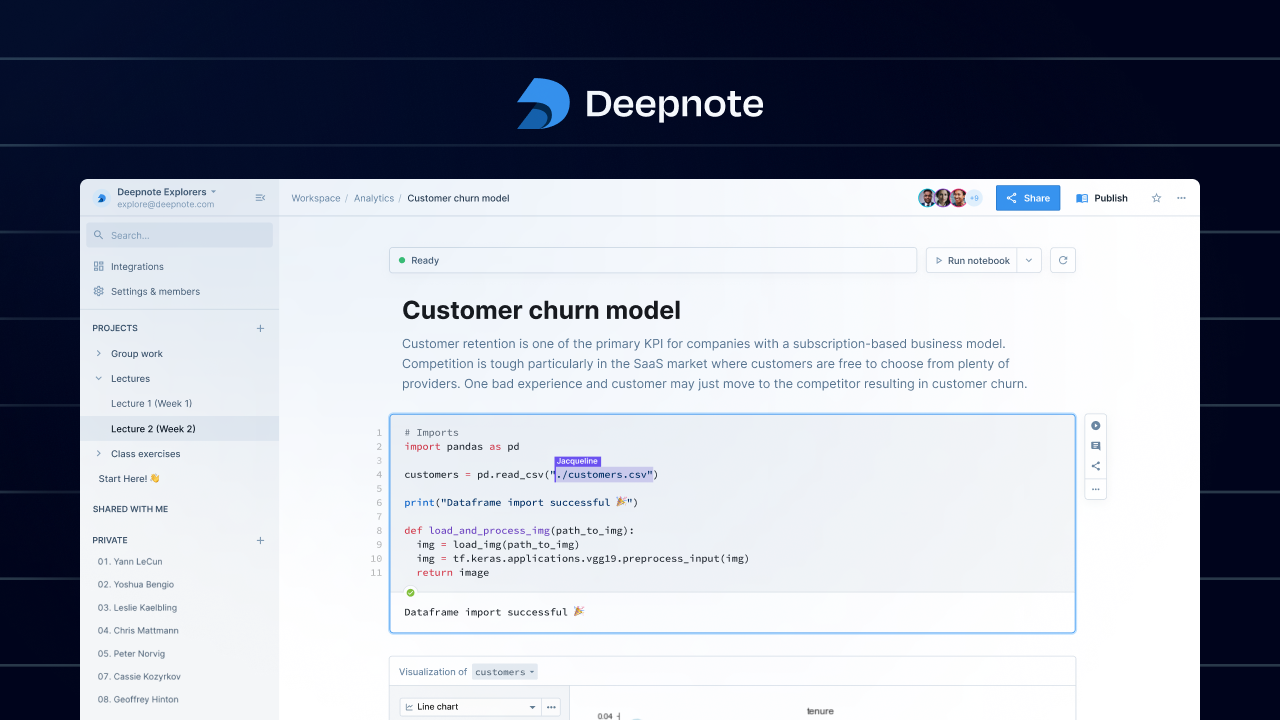
Deepnote Full homepage screenshot
Editorial Review

Website Review

What is Deepnote?

Deepnote is a cloud-based data workspace where teams combine Python, SQL and AI assistance in notebook-style projects, then turn the results into dashboards, data apps and automated alerts. Its pitch is consolidation: exploration, collaboration, scheduled pipelines and sharing live in one browser-based environment rather than being stitched together from separate tools.

What you actually do in it

  • Write Python and SQL in notebook cells to explore data, with AI help for generating queries, dashboards and follow-up analysis.
  • Publish results as interactive data apps or dashboards rather than static exports, and set alerts to monitor metrics over time.
  • Collaborate in real time, with code review, history and versioning for tracking changes.
  • Connect to external data sources and warehouses through integrations, including Spark and Snowpark for heavier computation.
  • Run machine learning work such as model training, serving and monitoring, with GPU options.

Who it suits

If you are… Deepnote is a reasonable fit when…
A data team in a startup or scale-up You want notebooks, sharing and scheduled jobs in one place without maintaining your own infrastructure
An analyst working with stakeholders You need to hand non-technical colleagues a live dashboard or app instead of a notebook file
A larger or regulated organisation Security and auditing matter — the site cites SOC2 and HIPAA among its compliance signals
A solo learner You mainly want free compute for coursework; lighter notebook tools may be enough

Trade-offs to weigh

Consolidation is convenient but creates dependency: your notebooks, scheduling and sharing all live with one vendor, so exporting work or migrating later takes planning. Cloud notebooks also assume reliable connectivity and comfort with data leaving your local machine, which some teams cannot accept. Finally, a broad feature set can be more than a small project needs.

Next step

If you are evaluating it, pick one recurring task — say a weekly churn or signups report you currently assemble by hand — and rebuild just that in a trial workspace. If it ends up as a shared, self-updating dashboard your colleagues can open without you, the platform is earning its place; if you only needed a scratchpad, a simpler notebook is cheaper. You can compare notes against Project Jupyter if local, open-source notebooks are your baseline, or Deepnote itself for the full feature and pricing detail.

How does Deepnote compare to Jupyter and Google Colab?

Deepnote, Jupyter, and Google Colab all run notebook-style code, but they are built for different working styles. Deepnote is positioned as a collaborative data workspace: the page emphasizes teamwork, sharing dashboards and data apps, 100s of integrations, SQL alongside Python, alerts, versioning, and enterprise security controls. Jupyter is the open-source notebook standard, typically run locally or on your own infrastructure. Google Colab is a hosted notebook service that leans toward quick, free access to GPUs and easy sharing, often for individuals and learning.

H3 Quick comparison

Aspect Deepnote Jupyter Google Colab
Primary focus Team analytics, data apps, collaboration Flexible open-source notebooks you host yourself Fast hosted notebooks, often for ML and learning
Collaboration Built around sharing and team workflows Depends on your setup (Git, JupyterHub, etc.) Sharing via Google Drive links
Data sources 100s of integrations highlighted Whatever you install and configure Common libraries and Google services
Production use Data apps, dashboards, alerts, versioning, security/auditing Possible but you assemble the stack Less aimed at production apps
Setup effort Low; hosted workspace Higher; you manage environments and servers Low; browser-based
Best for Teams shipping recurring analytics Custom, self-managed, or offline work Individuals prototyping or learning

H3 How to choose

  • Pick Deepnote if several people need to work in the same notebooks, publish dashboards or data apps, and connect many data sources without managing infrastructure.
  • Pick Jupyter if you need full control, offline access, custom packages, or already run your own servers and want no vendor dependency.
  • Pick Google Colab if you mainly want a quick hosted environment for experiments or coursework and don't need heavy team governance.

A practical next step: take one recurring analysis your team currently does in a notebook and try rebuilding it where collaboration matters most. If the bottleneck is sharing results and keeping them updated, Deepnote's app and alert features are the relevant difference; if the bottleneck is environment control, Jupyter wins; if it's just fast access to compute for a solo experiment, Colab is the simplest. You can also read Deepnote's own comparisons against Jupyter and Colab on Deepnote.

Can I use Deepnote for free or what are the pricing plans?

Deepnote can be used for free, but the free tier is aimed at individuals and small explorations rather than full team deployments. The site lists a dedicated pricing page, so check Deepnote for the current plan limits and seat rules before committing.

For most readers, the practical question is not "free or paid" but "which tier matches the work":

  • Solo learner or evaluator: A free plan is usually enough to test Python and SQL notebooks, connect a data source, and see whether the collaborative model fits your habits.
  • Small team sharing dashboards and data apps: You will likely need a paid tier once multiple people need to edit, publish, or govern the same projects.
  • Regulated or enterprise environment: If you need SOC2/HIPAA-style controls, auditing, or centralized security, expect an enterprise conversation rather than self-serve signup.

Deepnote's own positioning emphasizes collaboration, data apps, integrations, and security, which are the features most likely to sit behind paid tiers.

A useful next step: open the pricing page, list the two or three features you cannot work without (for example, number of editors, private projects, or scheduled alerts), and compare only those rows. If you are still deciding between tools, the site's comparison pages against Jupyter, Google Colab, and Databricks can help frame the trade-offs, though they are vendor-authored.

How do I connect Deepnote to my data sources and integrations?

Deepnote connects to data sources in two main ways: through native integrations for common warehouses and databases, and through code-based connections for anything else. The page lists "100s of integrations" and "Work with any data source" under its platform capabilities, so the practical path is usually to start with a built-in connector and fall back to Python/SQL libraries when your source isn't listed.

Typical connection flow

  1. Open your Deepnote project and add a data source from the integrations panel.
  2. Pick your source type (for example a warehouse, database, or file storage).
  3. Enter credentials or authenticate through the provider's standard method.
  4. Choose which schemas, tables, or buckets the project can access.
  5. Query the data with SQL cells or load it into Python for analysis.

What this looks like in practice

A fintech analyst might connect a warehouse, run a SQL cell to pull churn or transaction data, then add a Python cell to model it — all in the same notebook. A data engineer could use the same workspace for ETL/ELT pipelines and transformations, while a smaller team might just connect a spreadsheet export or a cloud bucket for a quick dashboard.

Choosing between native and code connections

Approach Best for Trade-off
Native integration Warehouses, common databases, cloud storage Fastest setup, but limited to supported sources
Code-based (Python/SQL libraries) Unusual APIs, custom systems, niche databases Full flexibility, but you manage credentials and drivers yourself

Access and security

Because notebooks can be shared, decide early whether credentials live in the project or in a workspace-level connection. The page mentions security and auditing features such as SOC2 and HIPAA, plus history and versioning, which matter if multiple people or agents will query the same source.

Next step

Check the integrations list in Deepnote against the systems you actually use, then connect one source end-to-end in a test project before rolling it out to your team. If your source isn't supported natively, confirm which Python driver or API client it offers — that determines how much setup work you'll do yourself.

Is Deepnote secure and compliant for enterprise use?

Deepnote is positioned for enterprise use and publishes SOC 2 and HIPAA alignment among its security features, alongside auditing and history/versioning. For most teams, that combination is the practical baseline: it means the vendor has been audited against recognized controls and that activity inside the workspace can be reviewed after the fact.

Deepnote

What the page supports

  • Security & auditing is listed as a platform capability, and the page names SOC 2 and HIPAA.
  • History & versioning lets you trace changes to notebooks and data assets.
  • Code reviews are built in, so changes can be checked before they reach shared work.
  • Enterprise appears as a distinct tier with a "Book a demo" path, which is where contract terms, SSO and data-residency questions typically get answered.

What to verify before signing

Compliance claims are a starting point, not a substitute for your own review. Ask for:

  1. The current SOC 2 report and its scope — which systems and time period it covers.
  2. A signed BAA if you handle protected health information, since HIPAA support depends on that agreement, not just the feature list.
  3. Where data is stored and processed, and whether you can pin it to a region.
  4. How SSO, SCIM and role-based access are configured on the Enterprise plan.
  5. Whether agents and AI features can be disabled or scoped, and what data they can reach.

A concrete scenario

A fintech analytics team wants a shared notebook environment but cannot let analysts paste production customer data into a tool the security team has not reviewed. The realistic path: run a trial with synthetic data, request the SOC 2 report and BAA, confirm SSO works with your identity provider, and test whether an admin can restrict which integrations and AI features are available. Only then move real data in.

If your requirement is a self-hosted deployment inside your own VPC, confirm that option exists before assuming it — the page emphasizes a hosted workspace with integrations, not on-premise installation.

How can I build and share data apps or dashboards in Deepnote?

Deepnote covers this in two related ways: notebooks that produce shareable outputs, and purpose-built data apps and dashboards. The page presents both under one workspace, alongside Python, SQL, AI assistance, and integrations with external data sources.

Notebook route (fastest to first result)

  1. Connect a data source and query it with SQL or Python in a notebook cell.
  2. Build the analysis, then add a follow-up cell or AI-generated insight to explain what the numbers show.
  3. Publish or share the notebook with your team so they see live results rather than a static export.

This suits analysts answering a specific question, and anyone who wants the reasoning visible next to the chart. The trade-off is that a notebook is a document first — readers can see code and intermediate steps, which is useful for review but noisier for an executive audience.

Data app or dashboard route (reusable, audience-facing)

The page lists "Data apps & dashboards — share your insights" as a distinct capability, with the example of a live PLG dashboard showing signups, activation and at-risk accounts published and shared with a revenue team. Treat that as the intended pattern: a notebook or SQL query becomes a persistent, refreshable view for people who will never open the code.

Choose this when the same metrics get asked for repeatedly, when non-technical stakeholders need to check numbers themselves, or when the output should update as data changes rather than being re-run by hand. The trade-off is more setup and more care about definitions — once a dashboard is shared widely, an unclear metric definition spreads just as fast as a correct one.

Practical decision criteria

  • One-off question, technical reader: keep it in the notebook.
  • Recurring metric, mixed audience: build the dashboard.
  • Mixed: build the analysis in a notebook, then surface only the final cells as the app.

Who this fits

The page cites 600,000+ data professionals and lists use cases across fintech, biotech, gaming, enterprise, startups, research and education. Teams already working in Python and SQL, or those wanting AI assistance inside the analysis loop, will find the workflow familiar. Teams whose reporting lives entirely in a BI tool with a semantic layer may prefer to keep dashboards there and use Deepnote for exploration.

Next step

Start with one recurring question your team asks weekly. Build it as a notebook, share it, and watch whether people return to it or keep asking you directly — that answer tells you whether it deserves to become a dashboard. Deepnote's own guides and tutorials section is the place to look for concrete how-tos, and the comparison pages (against Jupyter, Google Colab, Databricks and others) help if you are deciding between tools rather than learning the workflow. For a general-purpose alternative to compare against, see Project Jupyter.

Related questions

More questions →
What Does It Mean to Work With Data? A Beginner's Guide to Data Visualization and Statistics

Working with data means turning raw records into understanding. In practice, that breaks into five repeatable activities: collecting data, cleaning it, exploring it, visualizing it, and interpreting what the results do and do not support. Data visualization and statistics are two halves of the same job — statistics tells you whether a pattern is real and how uncertain it is, while visualization shows you the shape of the pattern and communicates it to others. You do not need a math or programming background to start; you need a question, a small dataset, and a tool simple enough that you spend your time thinking about the data rather than the software.

The Five Core Activities of Data Work

Most data projects, from a personal budget spreadsheet to a public health dashboard, move through the same stages.

1. Collecting

You gather observations: survey responses, website logs, sensor readings, government tables, or a hand-built spreadsheet. The key decision here is what counts as one row (a person? a day? a transaction?) and what each column measures. Getting this "unit of observation" wrong causes problems that no amount of later analysis can fix.

2. Cleaning

Real data arrives messy. Cleaning means handling missing values, fixing inconsistent categories ("USA," "U.S.," "United States"), correcting types (a date stored as text), and removing duplicates. Beginners are often surprised that this is the most time-consuming step. It usually is.

3. Exploring

Before making charts for others, you look for yourself. What is the range of each variable? Are there outliers? How are two variables related? Simple summaries — counts, averages, minimums, maximums — and quick scatterplots answer most early questions.

4. Visualizing

You encode values as position, length, color, or size so that patterns become visible. A good chart answers one question clearly. A bad chart hides the answer behind decoration or distorts it through a misleading axis.

5. Interpreting

You decide what the pattern means, how confident you should be, and what alternative explanations exist. This is where statistics and careful reasoning matter most.

Visualization vs. Statistics: How They Complement Each Other

These are not competing approaches. They answer different questions about the same data.

Question Better served by
Is there a relationship between two variables? Visualization (scatterplot)
How strong is it, and could it be chance? Statistics (correlation, regression, confidence intervals)
Are there clusters, gaps, or outliers? Visualization
How much uncertainty is in this estimate? Statistics
How do I explain this to a non-expert? Visualization
Did this change actually happen, or is it noise? Statistics

A practical rule: visualize to discover, model to confirm, visualize again to communicate. A scatterplot might reveal that one region behaves completely differently from the rest; a statistical model then tests whether that difference holds up; a final chart shows the finding to an audience.

Beginner-Friendly Tools and Formats

You can start with tools you already have.

  • Spreadsheets (Excel, Google Sheets): Best for datasets under a few thousand rows. Built-in chart types cover bar, line, scatter, and pie. Learn to sort, filter, and use pivot tables.
  • Chart types to master first: bar charts for comparisons, line charts for change over time, scatterplots for relationships, and histograms for distributions. These four cover most everyday questions.
  • Simple code options: If you want to go further, R (with ggplot2) and Python (with matplotlib or plotly) are common. Both have large free learning communities. Start with one, not both.
  • Design principles that matter more than the tool: label your axes, start bar charts at zero, avoid 3D effects, use color to encode meaning rather than decoration, and put the most important comparison in the most prominent position.

A Realistic Starting Path

If you have no data background, this sequence works:

  1. Pick a question you actually care about. "How has my city's rent changed over ten years?" beats a generic tutorial dataset.
  2. Find a small, public dataset. Government open-data portals and statistical agencies publish free tables.
  3. Load it into a spreadsheet and clean it. Fix types, remove duplicates, note missing values.
  4. Make three charts. One bar, one line, one scatter. Write one sentence under each describing what you see.
  5. Ask what could be misleading. Is the sample representative? Is the time range fair? Could a third factor explain the pattern?
  6. Repeat with a slightly harder question. Add a second variable, or try a simple statistical summary like a correlation or a group comparison.

Expect the first project to take longer than you think, mostly in cleaning. That is normal, not a sign you are doing it wrong.

What Data Can and Cannot Answer

Data can describe what happened, compare groups, estimate relationships, and quantify uncertainty. It cannot, on its own, establish causation without a proper study design, tell you what you should value, or compensate for a biased sample. A dataset collected from volunteers will not represent the general population no matter how sophisticated the analysis. Treat every result as "what this data suggests under these conditions," not as a final verdict.

Where to Go Next

FlowingData (flowingdata.com) focuses on data visualization and statistics for people who want practical, well-designed charts rather than academic theory. It is a reasonable place to browse examples, see how real datasets are turned into clear graphics, and pick up habits you can apply in your own work. Pair it with one spreadsheet tutorial and one public dataset, and you have everything you need for a first project.

The short version: working with data is a craft of asking clear questions, cleaning messy inputs, looking before you model, and communicating honestly. Start small, start visual, and let the statistics grow as your questions get harder.

How to Use Ahrefs for Your First SEO Audit: A Step-by-Step Tutorial

If you're new to Ahrefs and want to run your first SEO audit, the fastest path is: open Site Explorer, enter your target URL, review the Overview for a health snapshot, then dig into Organic Keywords, Top Pages, and Site Audit to find specific problems. From there, build a short prioritized to-do list instead of trying to fix everything at once.

This tutorial walks through that workflow using a realistic starting scenario, explains what the numbers mean, and shows how to turn findings into actions.

Before You Start: Pick a Narrow Scope

A common beginner mistake is auditing an entire large website on day one. The reports become overwhelming, and you can't tell which issues matter.

Instead, choose one of these starting points:

  • A single important page (your homepage or a key product/service page)
  • A small site (under ~50 pages, e.g., a personal blog or small business site)
  • One section of a bigger site (e.g., /blog/)

For this tutorial, assume you're auditing a small business site with about 30 pages. The same steps scale up later.

You'll need an Ahrefs account to follow along. Ahrefs offers paid plans, and pricing and feature limits change over time, so check the current Pricing page for what's included in each tier before committing.

Step 1: Enter Your Target in Site Explorer

Site Explorer is Ahrefs' core tool for analyzing any website or URL.

  1. Open Site Explorer from the top navigation.
  2. In the search box, paste your domain (e.g., example.com).
  3. Choose the Exact URL or Domain mode depending on scope. For a full-site view, use Domain or Prefix; for a single page, use Exact URL.
  4. Press Enter.

You'll land on the Overview report. Don't try to absorb everything — focus on four numbers first.

Reading the Overview Snapshot

Metric What it tells you How to use it
Ahrefs Rank (AR) Relative strength of the site's backlink profile vs. others in the database Useful for comparing against competitors, not as a standalone goal
Organic traffic Estimated monthly visits from search A rough trend indicator, not exact analytics
Organic keywords Estimated number of keywords the site ranks for Shows breadth of visibility
Backlinks / Referring domains Total links and unique sites linking to you Referring domains matter more than raw backlink count

Important caveat: Ahrefs' traffic and keyword numbers are estimates based on its own data. They won't match Google Search Console or your analytics exactly. Treat them as directional, not absolute.

Step 2: See What You Already Rank For

Go to Organic Keywords in the left sidebar. This shows queries where your site appears in search results.

Sort by Traffic (descending) to see which pages bring the most estimated visitors. Then look for:

  • Keywords ranking in positions 4–15 — these are often the easiest wins. A small content or on-page improvement can push them onto page one.
  • Keywords with high volume but low position — potential opportunities if the topic is relevant.
  • Irrelevant keywords — if you rank for something off-topic, it may signal thin or mismatched content.

Write down 5–10 of the position 4–15 keywords. These become your first optimization targets.

Step 3: Find Your Best and Weakest Pages

Open Top Pages. This ranks your URLs by estimated organic traffic.

Look for two things:

  1. Your top performers — understand what topics and formats work. Can you create more content like this?
  2. Pages with traffic but poor rankings — these may need on-page fixes (title, headings, internal links).

If a page gets zero traffic and targets a topic you care about, it's a candidate for a rewrite or consolidation.

Step 4: Run a Technical Site Audit

Now move to Site Audit. This crawls your site and flags technical and on-page issues.

  1. Click Site Audit → New project.
  2. Enter your domain and set crawl settings (default is usually fine for a small site).
  3. Start the crawl and wait for it to finish.

Once complete, you'll see a Health Score and a list of issues grouped by category.

Which Issues to Fix First

Not all issues are equal. Prioritize in this order:

Priority Issue type Why it matters
1 Broken links (404s) Bad for users and crawl efficiency
2 Pages blocked from indexing They can't rank at all
3 Missing or duplicate title tags Directly affects click-through and relevance
4 Slow-loading pages Affects experience and rankings
5 Thin content Low value to users and search engines

Ignore low-impact warnings (like minor meta description length) until the big items are handled.

Step 5: Turn Findings Into a To-Do List

You now have raw data. Convert it into a short, actionable list. Example:

  1. Fix 3 broken links found in Site Audit.
  2. Rewrite title tags on 5 pages with duplicate titles.
  3. Improve 4 pages ranking in positions 6–12 by adding missing subtopics and internal links.
  4. Remove or update 2 thin pages with no traffic.

Keep the list to 5–10 items max for your first audit. Finishing a short list beats starting a long one.

Common Beginner Mistakes

  • Chasing every red flag. Site Audit flags many minor issues. Fix what affects rankings and users first.
  • Trusting estimates as exact numbers. Ahrefs data is modeled, not measured from your analytics.
  • Auditing a huge site too early. Start small to learn the interface.
  • Ignoring search intent. A page can be technically perfect but still fail if it doesn't match what searchers want.
  • Forgetting to re-crawl. After fixes, run Site Audit again to confirm improvements.

Where to Go Next

Once your first audit is done:

  • Compare with competitors using Site Explorer's Competing Domains and Content Gap reports.
  • Track keyword rankings over time with Rank Tracker.
  • Explore backlink opportunities in the Backlinks and Link Intersect reports.
  • Set up recurring Site Audit crawls so new issues surface automatically.

Your first audit isn't about perfection — it's about building a repeatable habit: enter a target, read the key reports, pick the highest-impact fixes, and act. Do that once a month and your site's health compounds.

How Deepnote Compares to Jupyter and Google Colab

Deepnote is a hosted, collaborative data workspace; Jupyter is an open-source notebook environment you typically run and host yourself; Google Colab is a free-to-start hosted notebook service tied closely to Google's ecosystem and compute. The practical split: choose Deepnote when collaboration, sharing, and turning notebooks into data apps matter most; choose Jupyter when you need full control over environment and infrastructure; choose Colab when you want quick, low-friction access to GPUs and don't need team-grade workspace features. Deepnote's own site lists comparison pages for Jupyter and Google Colab, so the vendor positions itself directly against both.

Core differences at a glance

Dimension Deepnote Jupyter Google Colab
Hosting Hosted workspace (vendor-run) Self-hosted / local, or via third parties Hosted by Google
Primary focus Team collaboration + data apps Open-source notebook standard Quick notebooks + free compute
Languages Python & SQL (per site) Many kernels Primarily Python
Collaboration Built-in, real-time team work Depends on setup (e.g., JupyterHub) Shared notebooks via Google Drive
Turning notebooks into apps Data apps & dashboards, alerts Not built in Not a core feature
Integrations "100s of integrations" per site Via libraries/extensions Google ecosystem + libraries
Security/compliance SOC2, HIPAA cited Your responsibility Google Cloud terms

The rows above reflect what Deepnote's site states about itself; Jupyter and Colab characteristics are general, well-known properties of those tools rather than claims from the Deepnote page.

Where Deepnote differs most

Deepnote's page emphasizes three things that distinguish it from a plain notebook:

  • Collaboration as the default. The site frames Deepnote as a place to "work together with your team," with code reviews, history & versioning, and security & auditing listed as platform features. In Jupyter this is possible but usually requires extra infrastructure; in Colab, sharing is file-based.
  • From exploration to product. Deepnote lists "data apps & dashboards," alerts to monitor metrics, and a semantic layer (Modules, LookML, dbt). That's a step beyond a notebook — it's aimed at publishing insights, not just running cells.
  • Agents and AI. The current homepage headline is "The open data workspace built for humans agents," and it shows AI generating dashboards, answering questions, and building "autonomous data agents." This is a positioning choice; treat it as Deepnote's stated direction rather than a benchmark against Jupyter or Colab.

When each one fits

Choose Deepnote if: you work in a team, need shared notebooks with versioning and reviews, want to publish dashboards or data apps, and prefer a managed workspace over running your own servers. The site cites 600,000+ data pros and lists use cases across fintech, biotech, gaming, enterprise, startups, and research.

Choose Jupyter if: you need full control over the environment, want to avoid vendor lock-in, work with non-Python kernels, or already run your own infrastructure. It's the open standard many tools build on.

Choose Google Colab if: you want to start fast with free access to GPUs, your work is individual or lightweight, and you're comfortable inside Google's ecosystem. It's less oriented toward team workspaces and app deployment.

A concrete way to decide

If your task is "explore a dataset, then share a live dashboard with the revenue team," Deepnote's page shows exactly that flow — a PLG dashboard published and shared. If your task is "run a one-off training job on a GPU without setup," Colab is the lower-friction path. If your task is "build a reproducible pipeline on infrastructure I control," Jupyter (or a Jupyter-based platform) is the fit.

For a direct feature-by-feature view, Deepnote hosts comparison pages against Jupyter, Google Colab, Databricks, AWS SageMaker, Looker, Vertex AI, and others under its "Compare Deepnote..." section. Pricing details are on its pricing page; check current terms there rather than assuming a free tier.

What is Deepnote?

Deepnote is a collaborative data science notebook platform for exploring data with Python and SQL, working with a team, and sharing insights. It is positioned as "the open data workspace built for humans agents," and its own site describes it as bringing "all your data work in one workspace." If you need a shared environment where analysts, data scientists, and increasingly AI agents work on the same notebooks and data apps, Deepnote is built for that use case. If you only need a single-user notebook with no collaboration or app-sharing requirements, a simpler local setup may be enough.

What Deepnote does

The platform covers the full arc from quick exploration to production-style outputs:

  • Data analytics — Python and SQL for advanced analytics, plus an AI feature ("Deepnote AI") aimed at improving productivity.
  • Data apps & dashboards — turn notebook work into shareable apps and dashboards rather than static reports.
  • Alerts — monitor metrics and get notified when something changes.
  • Semantic layer — support for Modules, LookML, and dbt, so metrics can be defined once and reused.
  • Data engineering — ETL/ELT pipelines, data transformation, and a data catalog for documenting data assets.
  • High-performance computing — Spark and Snowpark support, plus GPUs for machine learning workloads.
  • Machine learning — model training, serving from a notebook, and model monitoring.
  • Governance — code reviews, history and versioning, and security/auditing including SOC2 and HIPAA.

How teams actually use it

The site's example workflow shows the intended pattern: a dashboard or data app is generated and published, then shared with a team (in the demo, the revenue team). A SQL cell queries data, and Deepnote AI surfaces an insight — for example, flagging that treatment users skipped onboarding more often and suggesting a segment-by-first-session-length follow-up before shipping. The same environment supports autonomous agents, such as a fraud-detection agent that summarizes and cancels fraudulent transactions by country and generates SQL blocks.

That combination — human analysis, AI-generated insight, and agent-run tasks in one workspace — is the core of the "humans agents" positioning.

Integrations and scale

Deepnote advertises hundreds of integrations so you can work with any data source. It reports that 600,000+ data professionals use it, and it lists customers across fintech and finance, biotechnology, gaming, enterprise, startups, and research, plus a stated use case for education.

Where it fits compared to alternatives

Deepnote's own site offers direct comparisons against Jupyter, Google Colab, Hyperquery, Databricks, AWS SageMaker, Looker, and Vertex AI. The meaningful differences to check when choosing:

Dimension What to verify
Collaboration Real-time multi-user editing vs. single-user notebooks
Language support Python and SQL in the same notebook
Output type Data apps and dashboards vs. notebook-only
AI/agents Built-in AI insights and autonomous agents
Governance Versioning, code review, SOC2/HIPAA
Compute Spark, Snowpark, and GPU availability

If your priority is a free, single-user notebook for learning, Colab or local Jupyter may cover it. If your priority is a governed, collaborative workspace that also hosts data apps and agents, Deepnote is aimed squarely at that.

Getting started

Deepnote offers a free "Get started" entry point, a separate Pricing page, and an Enterprise tier with a "Book a demo" option. Documentation, guides, webinars, a blog, a changelog, and a public roadmap are all available from the site. Pricing details and any login requirements are not specified in the available material, so check the Pricing page directly before assuming a plan or access level.

What Integrations and Security Features Does Deepnote Offer?

Deepnote connects to hundreds of data sources and ships with enterprise-grade security controls, including SOC2 and HIPAA compliance, security auditing, and version history. That combination makes it suitable for teams that need to pull data from many systems and still satisfy internal or regulatory review. The sections below cover what each capability actually does and where it fits.

Integrations: hundreds of data sources

Deepnote describes support for "100s of integrations," so you can work with any data source rather than being locked into one warehouse or file format. In practice this means a notebook can query a database, pull in a file, and combine results in the same workspace.

The platform's stated capabilities that depend on integrations include:

  • Python & SQL analytics — run SQL against connected sources and continue analysis in Python.
  • ETL/ELT pipelines — move and transform data as part of a data engineering workflow.
  • Data transformation and a data catalog — document data assets alongside the work that uses them.
  • Semantic layer support — works with Modules, LookML, and dbt.
  • Spark and Snowpark — high-performance computing on large datasets.
  • Machine learning workflows — model training, model serving from a notebook, and model monitoring, with GPUs available for heavy compute.

Because the source lists integration breadth but not a specific connector list, check the Deepnote docs for the exact source you need before committing. The relevant question is whether your primary database, warehouse, or file store is covered — if it is, the rest of the workflow stays in one place.

Security and compliance features

Deepnote's security page highlights SOC2 and HIPAA among its compliance credentials, and the platform lists security & auditing as a core capability. For teams handling sensitive data, the practical features are:

Feature What it does
SOC2 / HIPAA compliance Meets recognized standards for controls and protected health data
Security & auditing Tracks activity for review
History & versioning Lets you go back to earlier versions of work
Code reviews Catch bugs before changes ship

Two of these are easy to overlook but matter day to day. History & versioning means an accidental overwrite or a bad edit isn't permanent — you can return to a prior state. Code reviews bring the same review discipline used in software engineering to notebook code, which reduces the chance that an error reaches a shared dashboard or report.

Who this fits

The integration breadth and compliance set point to a few clear situations:

  • Enterprise and regulated teams that need SOC2 or HIPAA coverage before adopting a tool.
  • Teams with data spread across many systems who want one workspace instead of stitching tools together.
  • Data engineering and ML groups running pipelines, Spark/Snowpark jobs, or model training and monitoring.
  • Organizations that need an audit trail for who changed what and when.

If your work is a single small dataset in one format, the integration and compliance depth is more than you need. If you're coordinating across sources and stakeholders, it's the part that matters most.

How to verify before you commit

  1. Open the Deepnote docs and confirm your specific data source appears in the integration list.
  2. Check the security page for the compliance standard your organization requires (SOC2, HIPAA, or another).
  3. Confirm that auditing, version history, and code review cover your team's review requirements.
  4. For pricing and plan-level feature differences, see the pricing page — availability of specific features can vary by plan.

The main caveat: the source confirms these categories exist but doesn't detail every connector or every control. Treat the docs and security page as the authoritative check for your exact stack and compliance needs.

Website Overview

An established domain and managed infrastructure suggest continuity of operations and may support dependable delivery, although neither guarantees service quality. Several search or sharing settings need attention. Together they may make snippets, preview images or preferred URLs less consistent across platforms.

Domain and Registration

Registered in 2003, this domain has about 23 years of history. That suggests continuity, although ownership and purpose may have changed. Transfer-protection status is present, helping reduce the risk of unauthorized domain transfers. The registrar is NameCheap, Inc., a widely used domain service provider. The domain uses the common .com extension, which is not an independent safety signal.

DNS and Email

The lowest TTL is 40 seconds, supporting rapid record changes at the cost of more frequent lookups. Nameservers are provided by Amazon Route 53, indicating managed DNS hosting. MX records point to the Google Workspace email service. No CNAME was found; the observed records resolve directly to addresses. SPF and DMARC are configured. DKIM status is unknown.

TLS and Certificates

The certificate uses an RSA 2048-bit public key, offering broad client compatibility. The server supplied a complete certificate chain. No organization name is present in the certificate; the available fields are consistent with domain validation. The certificate was issued within the Amazon cloud or CDN ecosystem. The certificate is valid for about 197 days in total, with 121 days remaining.

HTTP and Browser Security

X-Powered-By exposes backend information: Next.js. The response lacks these common security headers: CSP. The x-cache, via response header indicates a CDN or caching proxy in the delivery path. No obvious internal addresses or debug information were found in the headers. No CORS permission header was found, so browsers normally restrict cross-origin script access.

Technology Stack Analysis

The public page identifies Next.js, Amazon CloudFront without precise versions, leaving fewer clues for version-specific scanning.

Search and Social Sharing

No homepage canonical URL was detected. If duplicate URLs exist, consolidation may be less explicit. Open Graph is partially configured; og:type is missing. JSON-LD includes Organization data, helping describe the organization as an entity. The title has 57 characters, within a common display range. A meta description is present, with 134 characters.

Hosting and Email

DNSAmazon Route 53
HostingAmazon CloudFront
EmailGoogle Workspace
Location United States flagUnited States 18.165.83.10

User reviews (0)

  • No reviews yet.

Pages, Search and Sharing

Meta descriptionExplore data with Python & SQL, work together with your team, and share insights that lead to action — all in one place with Deepnote.
Canonical URLNot detected
LanguageEnglish (default)
Twitter CardNot detected
All bots 0 allowed · 11 disallowed
  • Disallow/launch
  • Disallow/project
  • Disallow/workspace
  • Disallow/onboarding
  • Disallow/terms-10-29-2020
  • Disallow/terms-19-4-2023
  • Disallow/terms-20-4-2023
  • Disallow/privacy-10-29-2020
  • Disallow/privacy-11-28-2022
  • Disallow/privacy-06-25-2024
  • Disallow/thank-you

Registration details RDAP / WHOIS

RegistrarNameCheap, Inc.
Registered2003-04-08
Expires2027-04-08
Domain statusclient transfer prohibited
Nameserversns-102.awsdns-12.com、ns-1375.awsdns-43.org、ns-1897.awsdns-45.co.uk、ns-973.awsdns-57.net
DNSSECunsigned

DNS records

TypeNameValueTTLPriority
Adeepnote.com18.165.83.1040—
Adeepnote.com18.165.83.11740—
Adeepnote.com18.165.83.12540—
Adeepnote.com18.165.83.2840—
MXdeepnote.comaspmx.l.google.com3001
MXdeepnote.comalt1.aspmx.l.google.com3005
MXdeepnote.comalt2.aspmx.l.google.com3005
MXdeepnote.comaspmx2.googlemail.com30010
MXdeepnote.comaspmx3.googlemail.com30010
NSdeepnote.comns-102.awsdns-12.com300—
NSdeepnote.comns-1375.awsdns-43.org300—
NSdeepnote.comns-1897.awsdns-45.co.uk300—
NSdeepnote.comns-973.awsdns-57.net300—
TXTdeepnote.comMS=8709F03AE881166D17289B7B98485ECF1A680DA0300—
TXTdeepnote.combrevo-code:b67965a8d32a46bab9322c67dbfbe86a300—
TXTdeepnote.comfacebook-domain-verification=19b4tyksz769jxo55qhtnfm9jd5rv3300—
TXTdeepnote.comgoogle-site-verification=ZBHsZXnqvY3cs-knb1Fc0miM9X5o9diiH-oKnyFz-l0300—
TXTdeepnote.comgoogle-site-verification=lWVAE5UvxgCr_O0voy67QPR6AicwOXBYF7boxA1QhK4300—
TXTdeepnote.comopenai-domain-verification=dv-WhNo5yZ8D4mZzXCVuc5u6fOm300—
TXTdeepnote.comv=spf1 include:_spf.google.com ~all300—
DMARC_dmarc.deepnote_com._d.easydmarc.prov=DMARC1;p=none;rua=mailto:[email protected],mailto:[email protected];ruf=mailto:[email protected];fo=1;300—

TLS and certificates

AssessmentNormal configuration
Supported protocolsTLSv1.2、TLSv1.3
Negotiated protocolTLSv1.3
Certificate subjectdeepnote.com
IssuerAmazon
Valid until2027-01-30T23:59 · Remaining when checked: 121 days
Verification detailsCertificate trust: Passed · Hostname match: Passed

HTTP response headers

HeaderValue
content-typetext/html; charset=utf-8
cache-controlno-store, no-cache, must-revalidate, proxy-revalidate
strict-transport-securitymax-age=31536000; includeSubDomains; preload
x-frame-optionsDENY
x-content-type-optionsnosniff
referrer-policyno-referrer, strict-origin-when-cross-origin
permissions-policygeolocation=(), camera=(*), fullscreen=(*)

Identified technologies

Next.jsAmazon CloudFront

Recent Updates

  • Website images
  • Screenshots
  • Website Technologies
  • Pages and Search Information