Website profiles · Technology insights · Alternatives

earth.nullschool.net

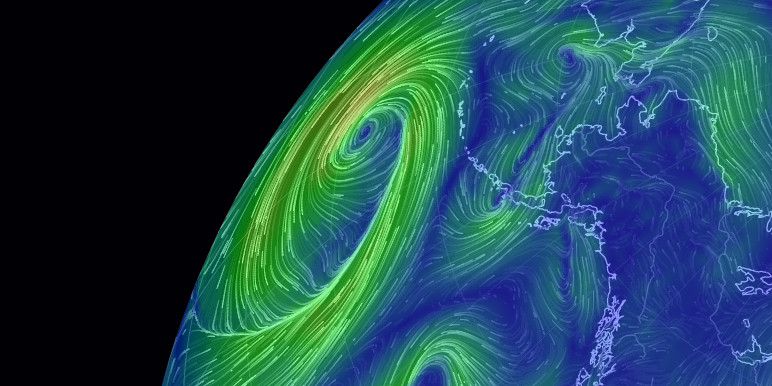
See current wind, weather, ocean, and pollution conditions, as forecast by supercomputers, on an interactive animated map. Updated every three hours.

No paid content found Multilingual
Visit website
Profile views 12 Outbound visits 12 Normal
earth : Full homepage screenshot

At a glance

Category
Data & Analytics
Language
English
Paid-content signal
No paid content foundObserved
Registered
2004
Hosting
CloudflareInferred
HTTPS certificate trusted
PassedObserved
Last updated

Website review

This review may include AI-generated content and is not individually verified. Domain, certificate and other facts come from the observed data on this page.

What is earth.nullschool.net?

earth.nullschool.net is a free, browser-based visualization tool that animates global weather, wind, ocean, and pollution data on an interactive world map. It renders forecast output from supercomputers as flowing particle streams, so you can watch wind patterns, ocean currents, or atmospheric chemistry move across the globe rather than reading numbers off a table. The data refreshes roughly every three hours.

It is not a forecasting service that writes text or issues warnings. It is a viewer for scientific model output, aimed at people who want to see how the atmosphere and oceans are behaving right now or at a chosen past or future time.

What you can actually look at

The site organizes data into modes, each with its own overlay options:

  • Air — wind speed, temperature, relative humidity, dew point, wet-bulb temperature, precipitation, CAPE (storm energy), precipitable water, mean sea level pressure, UV index, and wind power density, at several pressure levels from the surface up to 10 hPa.
  • Ocean — surface currents, peak wave period, significant wave height, sea surface temperature and its anomaly.
  • Chem — carbon monoxide, carbon dioxide, sulfur dioxide, nitrogen dioxide, dust and sulfate extinction, and particulate matter (PM1, PM2.5, PM10).
  • Particulates — a focused view of aerosol and particulate data.
  • Space — space weather, including aurora visibility probability.
  • Bio — biological indicators such as bleaching alert areas.

You can switch projections (Equirectangular, Orthographic, Waterman Butterfly, and others), toggle a coordinate grid, turn animation on or off, and use HD mode for sharper rendering.

Who gets the most out of it

If you are… Useful because…
A student or teacher Wind and current animation makes circulation patterns visible instead of abstract
A sailor, pilot, or paddler Quick sense of wind and wave fields before checking an official forecast
A journalist or communicator Striking visuals for explaining a storm, smoke plume, or heat pattern
An air-quality or climate watcher Particulate and chemistry layers show where pollution is moving
A curious generalist No account, no cost, and it loads fast

The trade-off is precision. Animated particles show direction and relative strength well, but this is a global model view, not a local forecast. For decisions where safety or timing matters, treat it as context and confirm with an official meteorological or maritime source.

A practical first step

Open the site, pick Air mode, leave the overlay on wind speed, and click anywhere on the map. A panel appears showing the exact values at that point. Then switch the overlay to temperature or PM2.5 and click the same spot — comparing two overlays at one location is the fastest way to understand what the tool is telling you. If you want a second opinion on the same conditions, Windy presents comparable global model data with a different interface, and Ventusky offers another take.

How often is the wind and weather data updated on earth.nullschool.net?

Data on earth is refreshed every three hours. The site describes its animated map as showing current wind, weather, ocean and pollution conditions as forecast by supercomputers, with that three-hour update cycle.

What that means in practice

  • Not live sensors. You are seeing model forecast output, not a real-time reading from a station near you. A "current" view is the most recent model run, so it can lag actual conditions by a few hours.
  • Forecast, not just now. The same time controls let you step forward, so a three-hourly cadence is the resolution you should expect when scrubbing through the coming days.
  • Good for patterns, weaker for timing. Three-hour steps are fine for watching a front move across a region, but they will not tell you that a squall line reaches your town at 4:15 pm.

A concrete scenario

If you are planning a coastal sail or a long cycle, check the latest run in the morning, then note the three-hour steps through the afternoon to see whether wind builds earlier or later than your plan assumes. For anything safety-critical, treat it as one input and confirm with an official national weather service forecast for your exact location.

Next step

Open the site, use the date and time controls to confirm which run you are viewing, and switch units to match your local convention before comparing it with another forecast.

Can I view past or future weather conditions on earth.nullschool.net?

Yes. The site is built around a time slider, so you can move backward and forward from the present rather than only seeing a live snapshot. The menu shows a Current Conditions button alongside a Choose Date control, and a date/time readout that can be switched between Local and UTC.

How the time controls work in practice

  • Choose Date opens a date picker so you can jump to a specific day instead of dragging the slider.
  • Current Conditions returns you to the present moment.
  • Start/Stop Animation plays the forecast forward, which is the easiest way to watch a system develop.
  • The Data Source and Scale controls sit next to the time controls, so you can tell which model run and which time scale you are looking at.

Past versus future: what to expect

Direction What you get Typical use
Past Archived forecast/analysis fields, useful for reconstructing what conditions looked like Checking what a storm looked like before it arrived, comparing a past event to a current one
Future Forecast fields from supercomputer models, updated periodically Trip planning, watching a developing weather system, checking wind or wave forecasts

The site states the map is updated every three hours, so the forward view is a rolling forecast rather than a long-range outlook. Treat the far end of the forecast as less certain, as you would with any model output.

A concrete example

Say you are planning a coastal sailing trip for the weekend. Start on Current Conditions, switch to Wind animation to see the general flow, then use Choose Date to step forward to your travel day. Switch the overlay to Waves or Peak Wave Period and the height layer to a surface or low-level pressure level to see whether the picture changes with altitude. If a system looks marginal, step backward a day or two to see how it has been evolving — a rapidly deepening pattern is a different risk than a steady one.

Choosing your view

  • If you want weather history for a specific event, go backward and use the date picker rather than the slider.
  • If you want planning guidance, stay in the forward half and check the same date at more than one overlay.
  • If you are comparing your local time with a model run, switch the readout between Local and UTC so you do not misread the timestamp.

As a next step, open the site, press Choose Date, and pick tomorrow — then toggle between Wind, Temp and one ocean overlay to see how the same moment looks across different variables.

What types of data layers are available on earth.nullschool.net, such as wind, ocean, or pollution?

earth organizes its animated global map into modes, each with its own overlay list. The modes named on the site are Air, Ocean, Chem (atmospheric chemistry), Particulates, Space (space weather), and Bio (biology). Wind and ocean currents are the animations most people recognize, but they sit inside a much larger set of selectable layers.

H3 What you can actually put on the map

  • Air: wind speed animation, plus overlays such as temperature, relative humidity, dew point, wet bulb temperature, 3-hour precipitation accumulation, CAPE (convective available potential energy from the surface), total precipitable water, total cloud water, mean sea level pressure, a "misery index," UV index and erythemal dose rate, and instantaneous wind power density. Pressure-level choices include surface and 1000, 850, 700, 500, 250, 70, and 10 hectopascals.
  • Ocean: ocean surface currents animation, peak wave period animation, and overlays for significant wave height, sea surface temperature, sea surface temperature anomaly, and bleaching alert area.
  • Chem: carbon monoxide surface concentration, carbon dioxide surface concentration, sulfur dioxide surface mass, nitrogen dioxide, dust extinction (aerosol optical thickness at 550 nm), organic matter aerosol optical thickness, and sulfate extinction.
  • Particulates: particulate matter under 1 μm, under 2.5 μm, and under 10 μm.
  • Space: probability of visible aurora.
  • Bio: bleaching alert area.

H3 How to choose a layer

Think in terms of the question you are asking, not the menu. For "will it be windy where I'm sailing or cycling this afternoon?", use the wind animation with the surface or 850 hPa level. For "is the air unhealthy today?", switch to Particulates and compare PM 2.5 with PM 10; the gap between them hints at whether coarse dust or fine combustion particles dominate. For coastal swimming, diving or surfing, Ocean currents plus significant wave height and sea surface temperature is the practical combination.

One caveat worth knowing: overlays are not all measured the same way. Some are surface values, some are pressure-level values, and the chemistry and particulate layers are model-based concentrations rather than local sensor readings. Treat the map as a global overview and a way to spot patterns, then check a national or local forecasting service before making a decision that depends on your exact street or harbor.

A useful next step: open the site, pick your mode, then use the date and time controls to step through the forecast rather than judging a single frame. Comparing the same layer at two different times often tells you more than staring at one snapshot.

Is earth.nullschool.net free to use, and does it have a mobile app?

Yes to both. The site is free to use, and a mobile app exists.

Free use

  • The site is an interactive animated map of wind, weather, ocean, and pollution conditions, with no pricing signals or payment options on the page.
  • It offers a menu for modes (Air, Ocean, Chem, Particulates, Space, Bio), overlays, projections, units, and timezone settings, plus a "support this site" option — suggesting donations rather than paid tiers.

Mobile app

  • The settings area includes a "get the app!" link, confirming an app alongside the web version.
  • The page also mentions a "Nullschool App" and a newsletter, and links to Facebook, Bluesky, YouTube, and Instagram.

Practical next step If you mainly want quick local wind or wave checks on a phone, try the app; for deeper exploration — switching between surface and 1000–10 hPa levels, or comparing PM2.5 with dust extinction — the desktop browser is easier. The site notes data updates every three hours and offers a classic version if the main page does not load correctly.

For related official sources, see nullschool.net and earth.nullschool.net.

How accurate is the forecast data on earth.nullschool.net compared to other weather services?

earth.nullschool.net is best understood as a visualization layer over forecast model output, not as a forecasting service that produces its own predictions. The accuracy you see therefore depends on the underlying model and the variable you are viewing, not on the site itself.

What the site actually shows

Its menu lets you switch between Air, Ocean, Chem, Particulates, Space and Bio modes, and within each mode choose an overlay such as wind speed, temperature, relative humidity, mean sea level pressure, ocean currents, significant wave height, sea surface temperature, or particulate matter. You can also step through forecast times and change the vertical level, from surface up to 10 hPa.

That structure matters for accuracy comparisons:

  • Wind and pressure fields are the most reliable overlays, because global models handle large-scale dynamics well and these variables are directly forecast.
  • Temperature, humidity and precipitation are reasonably trustworthy for broad patterns, but precipitation in particular is patchy at local scale.
  • Chemistry and particulate overlays (carbon monoxide, nitrogen dioxide, dust, PM2.5) come from different model systems and are generally coarser and less certain than basic weather variables.
  • Space weather and biology modes are niche products with their own specialized sources and uncertainty profiles.

How it compares with other services

Aspect earth.nullschool.net Typical consumer weather apps
What it is Animated global visualization of model output Point forecasts for a chosen location
Strength Seeing global flow, patterns and connections at once Deciding whether to carry an umbrella tomorrow
Local precision Limited; you read values off a moving global map Usually tuned for city or neighborhood level
Update rhythm Refreshed regularly, on the order of hours Often hourly or more frequent
Best use Context, education, pattern spotting Daily planning

A useful rule of thumb: if you want to know whether it will rain on your street at 4 p.m., a local forecast service will beat this site. If you want to understand why — a frontal system sweeping across a continent, a plume of dust crossing an ocean — this site is far more informative than a text forecast.

A practical test

Pick a day with a clear weather event near you, such as a cold front or a windy afternoon. Check the wind and pressure overlay here, then compare it with a national meteorological service such as the National Weather Service for the United States, or a global model viewer like Windy. If the broad pattern matches but the timing or local intensity differs, that is the normal gap between a global model visualization and a locally calibrated forecast — not a sign the site is wrong.

For official warnings and safety decisions, always go to the responsible national agency rather than an animated map.

Related questions

More questions →
Where Does earth.nullschool.net Get Its Data, and How Often Is It Updated?

earth.nullschool.net displays wind, weather, ocean, and pollution conditions "as forecast by supercomputers," and the site states the map is updated every three hours. The data is not measured directly by the site itself — it is forecast model output rendered onto an interactive animated map. You can switch between current conditions and a chosen date, and you can change the data source from the site's menu.

What the site says about its data

The site's own description is the clearest statement of provenance:

  • Conditions are shown "as forecast by supercomputers."
  • The map is "updated every three hours."
  • It covers wind, weather, ocean, and pollution conditions.

That means what you see is model forecast output, not a live sensor reading at your location. Treat it as a visualization of a forecast model, not as a measurement.

How to check the time and date of the data you're viewing

The interface gives you direct control over the time dimension:

  1. Open the menu (Show/Hide Menu).
  2. Use the date control to see the date information for the current view.
  3. Switch between Local and UTC time, and use Change Timezone if you want the timestamps in your own zone.
  4. Choose between Now (current conditions) and Choose Date to look at a specific date.

The Info Bar setting can show or hide the date information, so if the timestamp isn't visible, that's the first thing to check.

Changing the data source

The menu includes a Data Source control. Because the site aggregates multiple model outputs rather than a single feed, the source you select determines what the map is showing. The available modes reflect different model domains:

Mode What it covers
Air Wind and atmospheric fields
Ocean Currents, waves, sea surface temperature
Chem Atmospheric chemistry (CO, CO₂, SO₂, NO₂, aerosols)
Particulates PM1, PM2.5, PM10
Space Space weather, aurora probability
Bio Biology-related fields

Within Air and Ocean modes you can also select the scale (surface, 1000, 850, 700, 500, 250, 70, 10 hPa) and an overlay (wind speed, temperature, relative humidity, dew point, precipitation, CAPE, and others). The overlay you pick changes which variable is being displayed, so the "source" of what you're looking at depends on both the data source and the overlay selection.

Practical implications for reliability

A few things follow from the three-hour update cycle and forecast-based nature of the data:

  • It is not real-time observation. Between updates, the map reflects the most recent model run, not the current moment on the ground.
  • Resolution is global, not local. This is a planetary-scale visualization; it is not a substitute for a local forecast service if you need street-level accuracy.
  • Use it for patterns, not point predictions. The animated flow is well suited to seeing how wind or currents are moving across a region, which is different from asking "will it rain at my house at 3pm."

If the map isn't loading correctly, the site itself suggests trying classic.nullschool.net as a fallback.

What Is earth.nullschool.net?

earth.nullschool.net is a free, browser-based interactive map that visualizes global wind, weather, ocean, and pollution conditions forecast by supercomputers. It updates every three hours and requires no account. Use it when you want a fast, visual read on current or forecast atmospheric and oceanic conditions anywhere on Earth — not when you need precise point forecasts, historical archives, or downloadable datasets.

What you can see

The site organizes data into modes, each with its own animation and overlay options:

Mode Animation Example overlays
Air Wind Wind speed, temperature, relative humidity, dew point, wet bulb temperature, 3-hour precipitation, CAPE, total precipitable water, mean sea level pressure, UV index, wind power density
Ocean Surface currents, peak wave period Ocean currents, significant wave height, sea surface temperature, sea surface temperature anomaly, bleaching alert area
Chem Atmospheric chemistry Carbon monoxide, carbon dioxide, sulfur dioxide, nitrogen dioxide, dust extinction, organic matter aerosol, sulfate extinction
Particulates Particulates PM1, PM2.5, PM10
Space Space weather Probability of visible aurora
Bio Biology Bleaching alert area

Pressure levels for the Air mode range from surface and 1000 hPa up to 10 hPa, so you can look at different heights in the atmosphere rather than only at ground level.

How the map works

  • Animation shows the direction and relative speed of wind or currents as moving particles. Start and stop it from the menu.
  • Overlay colors the map by a chosen variable (temperature, pressure, PM2.5, and so on) while the animation continues on top.
  • Grid toggles a coordinate grid for locating features.
  • Projection options include Atlantis, Conic Equidistant, Equirectangular, Equal Earth, Orthographic, Patterson, Stereographic, Waterman Butterfly, and Winkel Tripel — useful for seeing the whole globe (Orthographic) or a flat world (Equirectangular).
  • Date and time can be set to local or UTC, and you can choose a specific date rather than only "now."
  • Units are switchable, and there is an HD mode plus a current-position mode.
  • Annotations can add active fires.

Practical notes

  • Data is forecast output from supercomputers, not live sensor readings, so treat it as a model view of conditions.
  • If the page does not load correctly, the site itself points to a classic version at classic.nullschool.net.
  • The interface is available in many languages, including English, Czech, Spanish, French, Hindi, Japanese, Korean, Portuguese, Russian, Simplified Chinese, and Traditional Chinese.
  • There is a companion app, a newsletter, and social channels linked from the site, plus an About page and a feedback form.

When to use it

Choose earth.nullschool.net for a quick global overview: seeing where winds are strong, tracking a plume, checking sea surface temperature anomalies, or watching aurora probability. For local, hourly, station-based forecasts or for research-grade data downloads, use a dedicated weather service instead.

How to Use the Modes and Overlays on earth.nullschool.net

earth.nullschool.net is an animated global map of wind, weather, ocean, and pollution conditions, generated from supercomputer forecasts and updated every three hours. To see different kinds of data, open the menu (labeled "earth Show/Hide Menu") and pick a mode first — this sets the broad category of data — then pick an overlay within that mode to choose the specific variable shown on the map. The mode and overlay controls are separate, so changing the overlay does not change the mode, and some overlays only make sense inside their own mode.

Step 1: Open the menu and choose a mode

Click the menu control to expand the panel. The mode buttons switch the entire dataset the map is drawing from:

  • Air — atmospheric fields such as wind, temperature, and pressure.
  • Ocean — ocean surface currents and wave data.
  • Chem — atmospheric chemistry, including trace gases.
  • Particulates — aerosol and particulate matter fields.
  • Space — space weather, including aurora probability.
  • Bio — biology-related fields, including bleaching alert areas.

The mode you select determines which overlays are available, so choose the mode before hunting for a specific variable.

Step 2: Pick an overlay inside the mode

Each mode exposes its own overlay list. Selecting an overlay changes the variable displayed on the animated map.

Air mode overlays

Overlay Meaning
Wind Wind speed
Temp Temperature
RH Relative humidity
Dew Dew point temperature
WBT Wet bulb temperature
3HPA 3-hour precipitation accumulation
CAPE Convective available potential energy from surface
TPW Total precipitable water
TCW Total cloud water
MSLP Mean sea level pressure
MI Misery index
UVI Ultraviolet index and erythemal dose rate
WPD Instantaneous wind power density
None No overlay

Ocean mode overlays

Overlay Meaning
Currents Ocean currents
Waves Peak wave period
HTSGW Significant wave height
SST Sea surface temperature
SSTA Sea surface temperature anomaly
BAA Bleaching alert area
None No overlay

Chem mode overlays

Overlay Meaning
COsc Carbon monoxide surface concentration
CO₂sc Carbon dioxide surface concentration
SO₂sm Sulfur dioxide surface mass
NO₂ Nitrogen dioxide

Particulates mode overlays

Overlay Meaning
DUex Dust extinction (aerosol optical thickness, 550 nm)
PM1 Particulate matter < 1 μm
PM2.5 Particulate matter < 2.5 μm
PM10 Particulate matter < 10 μm
OMaot Organic matter aerosol optical thickness (550 nm)
SO₄ex Sulfate extinction (aerosol optical thickness, 550 nm)

Space mode overlays

Overlay Meaning
Aurora Probability of visible aurora

Bio mode overlays

Overlay Meaning
BAA Bleaching alert area
None No overlay

Step 3: Adjust the animation and altitude controls

Inside Air mode you also get animation and level controls that change what the map is actually showing:

  • Animate — switch between Wind (wind animation) and Currents (ocean surface currents animation), plus Waves (peak wave period animation).
  • Height — select the pressure level the data is drawn from: Sfc (surface), 1000, 850, 700, 500, 250, 70, and 10 hectopascals (hPa). Lower hPa values correspond to higher altitudes, so a 250 hPa view shows upper-level flow rather than surface conditions.

Step 4: Use the menu settings for units, date, and timezone

The same menu contains controls that affect how values are labeled and which forecast time is shown:

  • Change Units — switch the unit system used for displayed values.
  • Date — choose between Now (current conditions) and Choose Date to view a specific forecast date.
  • Local / UTC and Change Timezone — control whether the displayed time is local or UTC.
  • Data Source and Scale — shown alongside the time controls.
  • Info Bar / date — show or hide the date information panel.

Step 5: Toggle grid, HD, and current position

These display toggles change how the map renders without changing the underlying data:

  • Grid / Toggle Grid — turn the coordinate grid on or off.
  • HD / High Definition Mode — switch to a higher-definition rendering.
  • Current Position Mode — center the view on your current position.
  • Start/Stop Animation — pause or resume the animated flow.

Step 6: Add annotations and change projection

  • Annotation — add Fires (active fires) or None (no annotations).
  • Projection — choose the map projection: A (Atlantis), CE (Conic Equidistant), E (Equirectangular), EQ (Equal Earth), O (Orthographic), P (Patterson), S (Stereographic), WB (Waterman Butterfly), or W3 (Winkel Tripel).

Common issues

  • The map does not load correctly. The site itself suggests trying classic.nullschool.net as a fallback.
  • An overlay seems missing. Overlays are scoped to modes — for example, PM2.5 only appears under Particulates, and Aurora only under Space. Switch modes first.
  • The map looks like it is showing the wrong altitude. Check the Height selector; a non-surface hPa level will not match ground-level conditions.
  • Times look off. Check whether Local or UTC is selected, and whether Now or Choose Date is active.

The interface is also available in multiple languages (including English, Čeština, Español, Français, हिन्दी, 日本語, 한국어, Português, Русский, 简体中文, and 繁體中文) via the language selector in the menu.

How to Change Settings and Find Support on earth.nullschool.net

Open the Settings panel from the site menu to change language, base map, and info bar options, and use the Links section of the same menu for About, feedback, newsletter, and social media. The projection controls sit in the menu itself rather than under Settings, so you may need to look in two places depending on what you want to change.

Changing the language

The Settings panel lists these languages, and selecting one switches the interface text:

  • English
  • Čeština
  • Español
  • Français
  • हिन्दी
  • 日本語
  • 한국어
  • Português
  • Русский
  • 简体中文
  • 繁體中文

Language choice affects menu labels and interface text. It does not change the underlying data, units, or the map itself.

Choosing a map projection

Projection options appear in the menu as single-letter or short codes. The available projections are:

Code Projection
A Atlantis
CE Conic Equidistant
E Equirectangular
EQ Equal Earth
O Orthographic
P Patterson
S Stereographic
WB Waterman Butterfly
W3 Winkel Tripel

Pick the one that matches how you want the globe represented. Equirectangular keeps latitude and longitude as straight lines, which is convenient for reading coordinates. Orthographic and Stereographic give a globe-like view. The others trade off shape and area distortion differently, so try a couple if the first one looks wrong for your purpose.

Adjusting the base map and info bar

Two display settings are available:

  • Base Map — choose between classic and detailed. Use detailed when you need more geographic reference; classic is lighter.
  • Info Bar — toggle the date display, which shows or hides date information.

Changing units

The menu includes a Change Units control. This affects how values are displayed across the data modes, so set it before reading numbers off the map.

Finding support and staying updated

The Links section of the menu contains:

  • about — background on the site
  • feedback — a form to report problems or send comments
  • Newsletter — sign-up for updates
  • Facebook, Bluesky, YouTube, Instagram — official social accounts
  • support this site — contribution channel

There is also a Nullschool App link if you prefer the app over the browser.

If the site is not loading correctly

The interface itself offers a fallback: a message reading "Not loading correctly? Try classic.nullschool.net" links to a classic version of the site. Use that when the main interface fails to render or animate.

A practical order of operations

If you are setting the site up for regular use, this sequence avoids redoing work:

  1. Open the menu and set Change Units first.
  2. Choose your language in Settings.
  3. Select a projection from the menu.
  4. Set Base Map to classic or detailed.
  5. Toggle the Info Bar date display as needed.
  6. Bookmark classic.nullschool.net separately in case the main view has trouble loading.

Data on the map is forecast by supercomputers and updated every three hours, so none of these settings change the freshness of what you see — they only change how it is presented.

What to Do If earth.nullschool.net Is Not Loading Correctly

If the map at earth.nullschool.net won't load, the site itself points to a first fix: open classic.nullschool.net instead. The current interface shows a "Not loading correctly? Try classic.nullschool.net" link, which suggests the classic version is the intended fallback when the main animated map fails. If that doesn't resolve it, the problem is usually local — browser, graphics, or network — rather than the site being down.

Start With the Site's Own Fallback

The main page includes a direct link to the classic version:

  • classic.nullschool.net — a lighter version of the same global wind, weather, and ocean map.

Try this first. If the classic version loads but the main one doesn't, the issue is likely with the newer interface or the graphics features it depends on, not with your connection to the site's data.

Check the Likely Causes

The main map is an animated, interactive visualization, so it depends on more than a normal webpage. Common failure points:

Browser and graphics (WebGL)

Animated map layers like this typically rely on WebGL for rendering. If WebGL is disabled, blocked, or unsupported, the map may appear blank or fail to animate.

  • Confirm you're using a current version of a mainstream browser.
  • Check whether hardware acceleration / WebGL is enabled in your browser settings.
  • Try a different browser to isolate whether it's a browser-specific problem.

Network and blocking

  • A firewall, VPN, proxy, or content blocker can interrupt the data the map pulls in.
  • Try another network, or temporarily disable extensions that block scripts.
  • If the page loads but stays empty, the data feed may be blocked even though the page itself loaded.

Cached or stale page

  • Do a hard refresh (reload bypassing cache) or clear the site's cached data.
  • Reload after switching networks to rule out a stale partial load.

Verify It's Working

Once the map loads, you should see an animated global view with a menu for modes and overlays. The site describes itself as showing current wind, weather, ocean, and pollution conditions forecast by supercomputers, updated every three hours. If you see the animation running and the menu responding, it's working.

If the animation is frozen, check the Start/Stop Animation control in the menu — it may simply be paused rather than broken.

If It Still Won't Load

Use the site's own support channels rather than guessing:

  • feedback — "Provide feedback about this site"
  • about — "About this site"
  • support this site

These links are in the site's menu and footer. Reporting what you see (blank map, no animation, error) helps narrow down whether it's a widespread issue or specific to your setup.

Quick Checklist

Step Action What it tells you
1 Open classic.nullschool.net Whether the fallback works
2 Try another browser Whether it's browser-specific
3 Check WebGL / hardware acceleration Whether graphics support is the cause
4 Disable blockers / change network Whether something is blocking the data
5 Hard refresh / clear cache Whether it's a stale load
6 Use feedback / about links How to report a persistent problem

Start with the classic version — it's the fastest way to tell whether the problem is on your end or with the main interface.

Website Overview

An established domain and managed infrastructure suggest continuity of operations and may support dependable delivery, although neither guarantees service quality. Page metadata, canonical configuration and social previews work together to provide more consistent search and sharing presentation.

Domain and Registration

Registered in 2004, this domain has about 22 years of history. That suggests continuity, although ownership and purpose may have changed. Transfer-protection status is present, helping reduce the risk of unauthorized domain transfers. The registrar is NameCheap, Inc., a widely used domain service provider. The domain uses the common .net extension, which is not an independent safety signal.

DNS and Email

Nameservers are provided by Cloudflare, indicating managed DNS hosting. MX records point to the Google Workspace email service. DNSSEC is enabled, allowing validating resolvers to authenticate signed DNS data. No CNAME was found; the observed records resolve directly to addresses. SPF and DMARC are configured. DKIM status is unknown.

TLS and Certificates

The public key uses EC with 256 bits. The server supplied a complete certificate chain. No organization name is present in the certificate; the available fields are consistent with domain validation. The certificate was issued within the Google Trust Services cloud or CDN ecosystem. The certificate's total validity is about 90 days, consistent with a short renewal cycle.

HTTP and Browser Security

The checked browser-security headers were not detected, leaving fewer explicit browser-side safeguards. No X-Powered-By header was found, reducing one common source of backend fingerprinting information. The cf-ray response header indicates a CDN or caching proxy in the delivery path. No obvious internal addresses or debug information were found in the headers. The Server header identifies cloudflare without an exact version.

Technology Stack Analysis

The public page identifies Google Analytics, Cloudflare without precise versions, leaving fewer clues for version-specific scanning.

Search and Social Sharing

The page declares 12 language or regional alternatives using hreflang. The title has 60 characters, within a common display range. A meta description is present, with 149 characters. The observed directives allow indexing and link following. No Generator meta tag is publicly exposed.

Hosting and Email

DNSCloudflare
HostingCloudflare
EmailGoogle Workspace
Approximate IP geolocation (inferred; a CDN or proxy may differ from the origin server) Location unknown Inferred 104.26.10.231

Registration details

RDAP / WHOIS

RegistrarNameCheap, Inc.
Registered2004-03-03
Expires2029-03-03
Domain statusclient transfer prohibited
Nameserversemma.ns.cloudflare.com、rick.ns.cloudflare.com
DNSSECsigned

DNS records

DNS

TypeNameValueTTLPriority
Aearth.nullschool.net104.26.10.231300—
Aearth.nullschool.net104.26.11.231300—
Aearth.nullschool.net172.67.75.143300—
AAAAearth.nullschool.net2606:4700:20::681a:ae7300—
AAAAearth.nullschool.net2606:4700:20::681a:be7300—
AAAAearth.nullschool.net2606:4700:20::ac43:4b8f300—
MXnullschool.netaspmx.l.google.com36001
MXnullschool.netalt1.aspmx.l.google.com36005
MXnullschool.netalt2.aspmx.l.google.com36005
MXnullschool.netalt3.aspmx.l.google.com360010
MXnullschool.netalt4.aspmx.l.google.com360010
NSnullschool.netemma.ns.cloudflare.com86400—
NSnullschool.netrick.ns.cloudflare.com86400—
TXTnullschool.netgoogle-site-verification=2HovbJFrfo_kHKYCGAXwch4154MvWqbkXOhcSn7uP_M300—
TXTnullschool.netgoogle-site-verification=4WDvHplk10Z6Kgfg07gDLqY98maZcmb8ufWRocywwec300—
TXTnullschool.netgoogle-site-verification=aby3X7eoD88gKK3pJ1XPe_YusXhQGr945I74ez7auTU300—
TXTnullschool.netgoogle-site-verification=y4fd8wtarYVABRokLUOQ7dEegsklrwoNHWmXVpX--V8300—
TXTnullschool.netv=spf1 include:_spf.google.com ~all300—
DSnullschool.net2371 13 2 70bd2fe2031ace64da7a8bbbe5743b55e2c7ad703f74f9baed7ff8702cbfc9de86400—
DMARC_dmarc.nullschool.netv=DMARC1; p=reject; rua=mailto:[email protected]300—

TLS and certificates

TLS / SSL

AssessmentNormal configuration
Supported protocolsTLSv1.2、TLSv1.3
Negotiated protocolTLSv1.3
Certificate subjectnullschool.net
IssuerGoogle Trust Services
Valid until2026-12-16T14:03 · Remaining when checked: 74 days
Verification detailsCertificate trust: Passed · Hostname match: Passed

HTTP response headers

HTTP

HeaderValue
content-typetext/html;charset=utf-8
cache-controlpublic, max-age=21600
servercloudflare

Identified technologies

Google AnalyticsCloudflare

Pages, Search and Sharing

Meta descriptionSee current wind, weather, ocean, and pollution conditions, as forecast by supercomputers, on an interactive animated map. Updated every three hours.
Canonical URLhttps://earth.nullschool.net/
LanguageEnglish (default) · Multilingual
Twitter CardNot detected
All bots 1 allowed · 0 disallowed
  • Allow/

No sitemaps found

User reviews (0)

  • No reviews yet.