
 chartgo.com
No paid content found
chartgo.com
No paid content found
 Multilingual
Categories: Data & Analytics
Create vibrant, professional graphs instantly with ChartGo – a free and easy-to-use tool for bar charts, line charts, pie charts, and more. Start charting now!
 Visit website
 Updated: 2026-09-29 23:50
Language: English (default)
Updated: 2026-09-29 23:50
Language: English (default)
 Access: Normal
 Profile views 1
 Outbound visits 0
Related questions
More questions →What Does It Mean to Work With Data? A Beginner's Guide to Data Visualization and Statistics
Working with data means turning raw records into understanding. In practice, that breaks into five repeatable activities: collecting data, cleaning it, exploring it, visualizing it, and interpreting what the results do and do not support. Data visualization and statistics are two halves of the same job — statistics tells you whether a pattern is real and how uncertain it is, while visualization shows you the shape of the pattern and communicates it to others. You do not need a math or programming background to start; you need a question, a small dataset, and a tool simple enough that you spend your time thinking about the data rather than the software.
The Five Core Activities of Data Work
Most data projects, from a personal budget spreadsheet to a public health dashboard, move through the same stages.
1. Collecting
You gather observations: survey responses, website logs, sensor readings, government tables, or a hand-built spreadsheet. The key decision here is what counts as one row (a person? a day? a transaction?) and what each column measures. Getting this "unit of observation" wrong causes problems that no amount of later analysis can fix.
2. Cleaning
Real data arrives messy. Cleaning means handling missing values, fixing inconsistent categories ("USA," "U.S.," "United States"), correcting types (a date stored as text), and removing duplicates. Beginners are often surprised that this is the most time-consuming step. It usually is.
3. Exploring
Before making charts for others, you look for yourself. What is the range of each variable? Are there outliers? How are two variables related? Simple summaries — counts, averages, minimums, maximums — and quick scatterplots answer most early questions.
4. Visualizing
You encode values as position, length, color, or size so that patterns become visible. A good chart answers one question clearly. A bad chart hides the answer behind decoration or distorts it through a misleading axis.
5. Interpreting
You decide what the pattern means, how confident you should be, and what alternative explanations exist. This is where statistics and careful reasoning matter most.
Visualization vs. Statistics: How They Complement Each Other
These are not competing approaches. They answer different questions about the same data.
| Question | Better served by |
|---|---|
| Is there a relationship between two variables? | Visualization (scatterplot) |
| How strong is it, and could it be chance? | Statistics (correlation, regression, confidence intervals) |
| Are there clusters, gaps, or outliers? | Visualization |
| How much uncertainty is in this estimate? | Statistics |
| How do I explain this to a non-expert? | Visualization |
| Did this change actually happen, or is it noise? | Statistics |
A practical rule: visualize to discover, model to confirm, visualize again to communicate. A scatterplot might reveal that one region behaves completely differently from the rest; a statistical model then tests whether that difference holds up; a final chart shows the finding to an audience.
Beginner-Friendly Tools and Formats
You can start with tools you already have.
- Spreadsheets (Excel, Google Sheets): Best for datasets under a few thousand rows. Built-in chart types cover bar, line, scatter, and pie. Learn to sort, filter, and use pivot tables.
- Chart types to master first: bar charts for comparisons, line charts for change over time, scatterplots for relationships, and histograms for distributions. These four cover most everyday questions.
- Simple code options: If you want to go further, R (with ggplot2) and Python (with matplotlib or plotly) are common. Both have large free learning communities. Start with one, not both.
- Design principles that matter more than the tool: label your axes, start bar charts at zero, avoid 3D effects, use color to encode meaning rather than decoration, and put the most important comparison in the most prominent position.
A Realistic Starting Path
If you have no data background, this sequence works:
- Pick a question you actually care about. "How has my city's rent changed over ten years?" beats a generic tutorial dataset.
- Find a small, public dataset. Government open-data portals and statistical agencies publish free tables.
- Load it into a spreadsheet and clean it. Fix types, remove duplicates, note missing values.
- Make three charts. One bar, one line, one scatter. Write one sentence under each describing what you see.
- Ask what could be misleading. Is the sample representative? Is the time range fair? Could a third factor explain the pattern?
- Repeat with a slightly harder question. Add a second variable, or try a simple statistical summary like a correlation or a group comparison.
Expect the first project to take longer than you think, mostly in cleaning. That is normal, not a sign you are doing it wrong.
What Data Can and Cannot Answer
Data can describe what happened, compare groups, estimate relationships, and quantify uncertainty. It cannot, on its own, establish causation without a proper study design, tell you what you should value, or compensate for a biased sample. A dataset collected from volunteers will not represent the general population no matter how sophisticated the analysis. Treat every result as "what this data suggests under these conditions," not as a final verdict.
Where to Go Next
FlowingData (flowingdata.com) focuses on data visualization and statistics for people who want practical, well-designed charts rather than academic theory. It is a reasonable place to browse examples, see how real datasets are turned into clear graphics, and pick up habits you can apply in your own work. Pair it with one spreadsheet tutorial and one public dataset, and you have everything you need for a first project.
The short version: working with data is a craft of asking clear questions, cleaning messy inputs, looking before you model, and communicating honestly. Start small, start visual, and let the statistics grow as your questions get harder.
Website Overview
Identifiable technologies and additional version or configuration signals make the service easier to fingerprint, which may help targeted scanners narrow their checks. An established domain and managed infrastructure suggest continuity of operations and may support dependable delivery, although neither guarantees service quality.
Domain and Registration
Registered in 2009, this domain has about 17 years of history. That suggests continuity, although ownership and purpose may have changed. Transfer-protection status is present, helping reduce the risk of unauthorized domain transfers. The registrar is GoDaddy.com, LLC, a widely used domain service provider. The domain uses the common .com extension, which is not an independent safety signal.
DNS and Email
Nameservers are provided by GoDaddy, indicating managed DNS hosting. MX records point to the Microsoft 365 email service. No CNAME was found; the observed records resolve directly to addresses. SPF and DMARC are configured. DKIM status is unknown. DNSSEC signatures were not detected, so this additional DNS authenticity protection is not confirmed.
TLS and Certificates
The public key uses EC with 256 bits. The server supplied a complete certificate chain. No organization name is present in the certificate; the available fields are consistent with domain validation. The certificate was issued by Let's Encrypt, commonly associated with automated certificate services. The certificate's total validity is about 89 days, consistent with a short renewal cycle.
HTTP and Browser Security
The Server header exposes the software version: nginx/1.26.3 (Ubuntu). This makes version-targeted checks easier, but is not proof of an exploitable vulnerability. The response lacks these common security headers: HSTS, CSP, clickjacking protection. No X-Powered-By header was found, reducing one common source of backend fingerprinting information. No obvious internal addresses or debug information were found in the headers. No explicit CDN or WAF marker was found in the response headers.
Technology Stack Analysis
The public page identifies jQuery, Google Analytics, nginx 1.26.3, with exact versions exposed for 1 technologies. These details can narrow vulnerability checks, although exposure alone is not a vulnerability.
Search and Social Sharing
The canonical URL points to another host: https://www.chartgo.com/home.html. Search engines may consolidate indexing signals there. The page declares 5 language or regional alternatives using hreflang. The title has 56 characters, within a common display range. A meta description is present, with 159 characters. The observed directives allow indexing and link following.
 Hosting and Email
 GoDaddy
 Hosting
 OVH SAS
 Microsoft 365
 Location
 Quebec, Canada
 Pages, Search and Sharing
| Meta description | Create vibrant, professional graphs instantly with ChartGo – a free and easy-to-use tool for bar charts, line charts, pie charts, and more. Start charting now! |
|---|---|
| Canonical URL | https://www.chartgo.com/home.html |
| Language | English (default) · Multilingual |
| Twitter Card | Not detected |
Social Sharing Preview
8 fields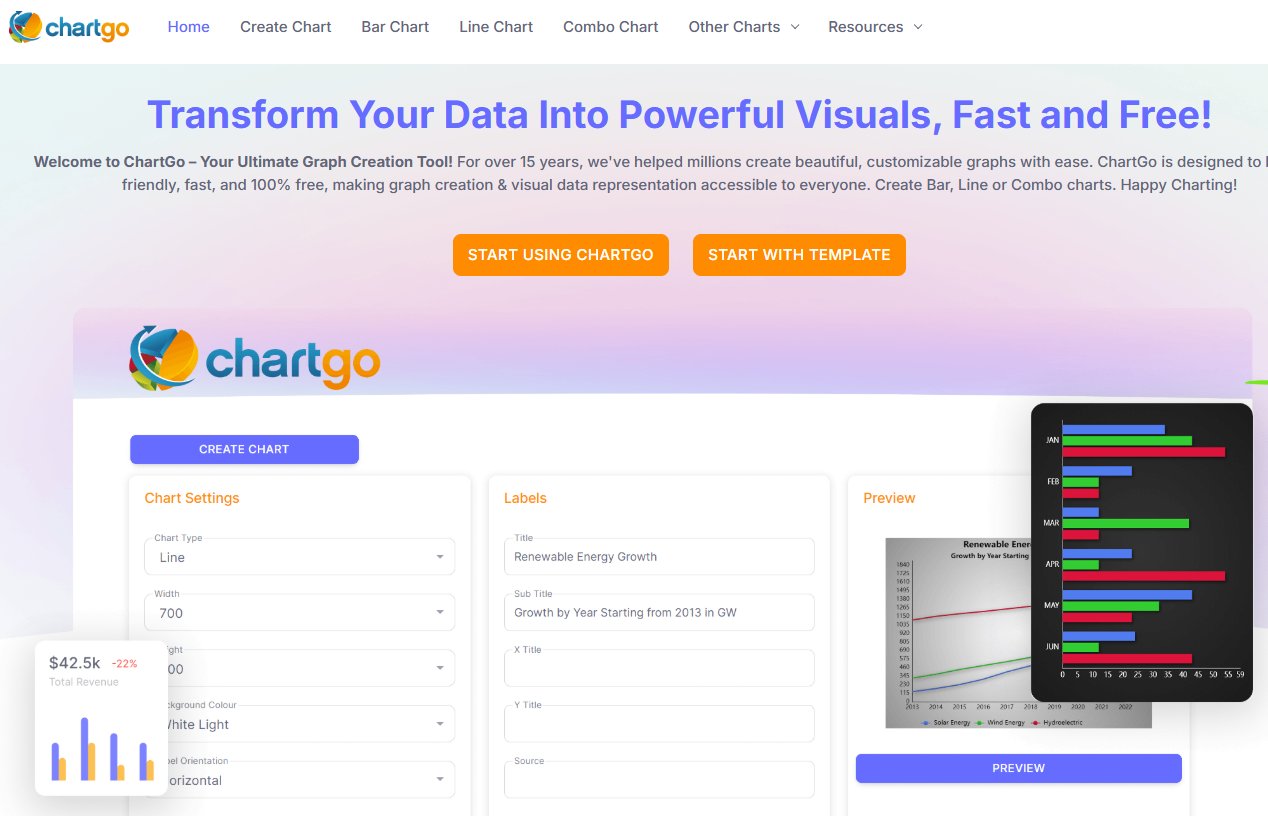
Sharing metadata
| og:url | https://www.chartgo.com/home.html |
|---|---|
| og:type | website |
| og:image | https://www.chartgo.com/images/social/ogdefaultlight.jpg |
| og:title | Create Stunning, Customizable Graphs Instantly and for Free. |
| og:locale | en_US |
| og:image:alt | Displays a print screen of the home page. |
| og:site_name | chartgo.com |
| og:description | Transform Your Data Into Powerful Visuals, Fast and Free! |
robots.txt (opens in a new tab)
40 rulesgptbot 0 allowed · 3 disallowed

 gptbot

/*?*/*do*/*jsessionid*
ccbot 0 allowed · 3 disallowed
/*?*/*do*/*jsessionid*
bingbot 0 allowed · 3 disallowed
/*?*/*do*/*jsessionid*
googlebot 0 allowed · 3 disallowed
/*?*/*do*/*jsessionid*
googlebot-image 0 allowed · 3 disallowed
/*?*/*do*/*jsessionid*
googlebot-video 0 allowed · 3 disallowed
/*?*/*do*/*jsessionid*
google-inspectiontool 0 allowed · 3 disallowed
/*?*/*do*/*jsessionid*
slurp 0 allowed · 3 disallowed
/*?*/*do*/*jsessionid*
teoma 0 allowed · 3 disallowed
/*?*/*do*/*jsessionid*
telegrambot 0 allowed · 3 disallowed
/*?*/*do*/*jsessionid*
twitterbot 0 allowed · 1 disallowed
/*jsessionid*
linkedinbot 0 allowed · 1 disallowed
/*jsessionid*
facebookbot 0 allowed · 1 disallowed
/*jsessionid*
facebookexternalhit 0 allowed · 1 disallowed
/*jsessionid*
meta-externalfetcher 0 allowed · 1 disallowed
/*jsessionid*
meta-externalagent 0 allowed · 1 disallowed
/*jsessionid*
All bots 0 allowed · 4 disallowed
/*?*/*do*/stylecss//*jsessionid*
No matching rules.
Sitemaps
1 Registration details RDAP / WHOIS
| Registrar | GoDaddy.com, LLC |
|---|---|
| Registered | 2009-05-17 |
| Expires | 2028-05-17 |
| Domain status | client delete prohibited、client renew prohibited、client transfer prohibited、client update prohibited |
| Nameservers | ns39.domaincontrol.com、ns40.domaincontrol.com |
| DNSSEC | unsigned |
 DNS records
| Type | Name | Value | TTL | Priority |
|---|---|---|---|---|
| A | chartgo.com | 51.222.28.244 | 600 | — |
| MX | chartgo.com | chartgo-com.mail.protection.outlook.com | 3600 | 0 |
| NS | chartgo.com | ns39.domaincontrol.com | 3600 | — |
| NS | chartgo.com | ns40.domaincontrol.com | 3600 | — |
| TXT | chartgo.com | NETORGFT20112791.onmicrosoft.com | 3600 | — |
| TXT | chartgo.com | v=spf1 include:secureserver.net include:spf.protection.outlook.com include:spf.smtp2go.com -all | 3600 | — |
| DMARC | _dmarc.chartgo.com | v=DMARC1; p=quarantine; adkim=r; aspf=r; rua=mailto:[email protected]; | 3600 | — |
 TLS and certificates
| Assessment | Normal configuration |
|---|---|
| Supported protocols | TLSv1.2、TLSv1.3 |
| Negotiated protocol | TLSv1.3 |
| Certificate subject | chartgo.com |
| Issuer | Let's Encrypt |
| Valid until | 2026-11-10T09:02 · Remaining when checked: 41 days |
| Verification details | Certificate trust: Passed · Hostname match: Passed |
 HTTP response headers
| Header | Value |
|---|---|
| content-type | text/html |
| server | nginx/1.26.3 (Ubuntu) |
| x-content-type-options | nosniff |
| referrer-policy | strict-origin-when-cross-origin |
| permissions-policy | geolocation=(), camera=(), microphone=() |
 Identified technologies
Recent Updates
- Website images
- Screenshots
- Network details
- Website Technologies
- Pages and Search Information
- HTTP Response Information
- TLS and certificates
- DNS Information
- Domain Registration
- Website profile
- Website Description
- Website Name
User reviews (0)