

 Visit website
 Updated: 2026-10-09 03:39
 Language: English (default)
 Access: Normal
 Profile views 4
  Outbound visits 0
 Website Review
What is lightest?
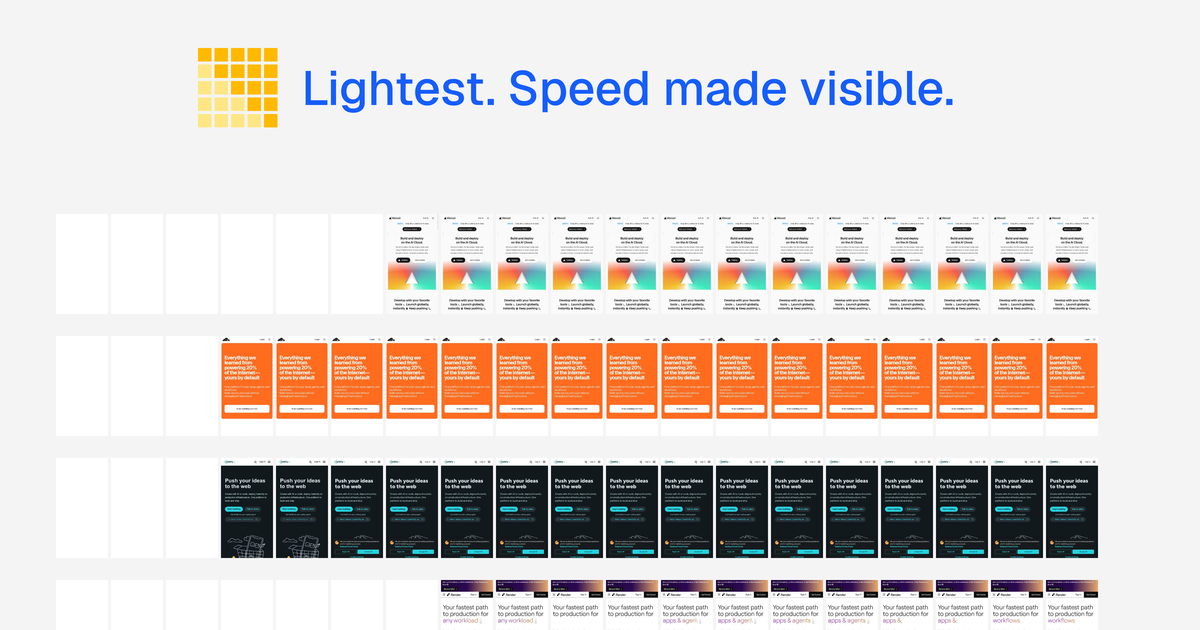
Lightest is a web performance tool that visualises how pages load over time. Rather than reporting a single score, it places page loads on a shared timeline so you can compare them frame by frame — a filmstrip-style view of what a visitor actually sees as each page renders.
What it is useful for
- Side-by-side comparison. Put two or more URLs on the same timeline and see which one paints content sooner, and where the slower one stalls.
- Diagnosing perceived speed. A page can finish loading quickly yet feel slow if the main content appears late. A frame-by-frame view makes that gap obvious in a way a single number does not.
- Before-and-after checks. Compare a staging URL against production, or an older build against a new one, to confirm a change actually improved rendering.
Who tends to need it
Developers and performance engineers who already read Lighthouse or Core Web Vitals reports but want the visual story behind them; designers and product managers who need to argue about speed with something stakeholders can watch rather than interpret; and anyone evaluating a competitor's or a vendor's site before committing to a redesign or a platform migration.
How it fits alongside other tools
Use it as the diagnostic layer, not the whole toolkit. Lab tools such as web.dev explain the metrics and thresholds, and PageSpeed Insights gives you field and lab data for a single URL. Lightest's contribution is the comparison view: it answers "which of these is faster, and where does the difference show up?" rather than "what is this page's score?" Real-user monitoring, by contrast, tells you what actual visitors experienced across devices and networks — something a comparison tool cannot substitute for.
A practical way to start
Pick one page that matters — a landing page, a product detail page, a checkout step — and load it in Lightest next to the version you consider your benchmark. Watch where the first meaningful content appears in each filmstrip, note the moment the layouts diverge, then take that specific moment back to your own tooling to find the cause. Comparing three or four pages at once is usually less informative than following one clear difference to its source.
How does lightest compare page load performance side by side?
Lightest presents page-load performance as a visual, side-by-side comparison on a shared timeline. Its tagline, "Speed made visible," and description — "Compare how pages load, frame by frame, on a shared timeline" — point to a filmstrip-style view: rather than only reporting a single score, it shows how each page progressively renders so you can see when content appears and how the two experiences diverge over time. The page evidence also lists categories such as custom, clouds, ai, ecommerce, and news, plus a "url compare" entry, suggesting you can line up real URLs and compare them within a shared timing context.
What the side-by-side view is useful for
- Judging perceived speed, not just totals. Two pages can finish loading in similar time but feel very different if one shows meaningful content early and the other stays blank. A shared timeline makes that visible.
- Comparing a change against a baseline. Put the current version and a revised version next to each other to see whether a fix actually moved the moment content appears.
- Benchmarking against a competitor or reference site. The category labels (ecommerce, news, and so on) hint at comparing within a realistic peer group.
- Spotting render-blocking behavior. Watching frame by frame helps you notice when a page stalls before painting anything useful.
How it differs from score-based tools
| Approach | What you get | Best for |
|---|---|---|
| Shared-timeline visual comparison | Frame-by-frame rendering on one timeline | Understanding when content appears and how two pages feel different |
| Single-page audit scores | Numeric ratings and diagnostics for one URL | Tracking regressions and getting fix recommendations |
A score tells you a page is slow; a synchronized filmstrip tells you where in the load it feels slow. They answer different questions, and the visual view is usually the more persuasive one when you need to explain a problem to designers or stakeholders.
A practical next step
Pick a page you care about and a known reference — your own previous version, or a competitor in the same category — and load both side by side. Watch the first few seconds specifically: note the moment the main content becomes readable on each. If your page lags noticeably behind on that moment, that gap is your priority, regardless of what any overall score says. For a complementary numeric check on the same URLs, PageSpeed Insights and WebPageTest are established options; Lightest's value is the synchronized visual read rather than the score itself.
Can lightest show frame-by-frame filmstrip comparisons of different pages?
Yes. Lightest is built around comparing how pages load on a shared timeline, and its filmstrip view is the mechanism for that: you see the sequence of rendered frames side by side rather than a single load-time number.
What a filmstrip comparison shows you
- Visual progress over time: each frame captures what a visitor actually saw at that moment, so you can spot a blank screen, late hero image or layout shift that a summary metric hides.
- Relative pacing: on one timeline, a fast page and a slow page are directly comparable — you can see which one paints first and which one finishes.
- Where the gap comes from: a page that looks fine in isolation often reveals a stalled third-party script or a slow font when placed next to a competitor.
Practical uses
- Competitive benchmarking: run your product page against two or three rivals and note when each one becomes usable, not just when it finishes loading.
- Regression checks after a deploy: compare the same URL before and after a release to catch a newly blocking resource.
- Stakeholder conversations: frames are easier to argue with than a Lighthouse score, because everyone can see the empty screen.
Limits worth knowing
A filmstrip tells you when something appeared, not why. Pair it with a trace or waterfall to identify the blocking request, and treat the visual comparison as the diagnosis aid rather than the fix. Results also depend on network and device conditions, so keep those consistent across the pages you compare.
Next step
Pick one page that matters commercially — a signup or product page — and compare it against the two sites your visitors most likely came from. Look for the first frame where meaningful content is visible, and use that moment as your benchmark rather than full load. For a second opinion on the same URLs, PageSpeed Insights reports field and lab data, and WebPageTest gives you filmstrips with controllable connection profiles.
How does lightest relate to Lighthouse and Core Web Vitals?
Lightest is a visual comparison tool, not a scoring or auditing engine. Its stated purpose is to show how pages load frame by frame on a shared timeline, so you can put two or more sites side by side and watch the same moments unfold. Lighthouse, by contrast, runs an audit in a single browser context and returns lab metrics, opportunities and a performance score. Core Web Vitals are the field-facing metrics Google uses to summarise real-user experience: loading (LCP), interactivity (INP) and visual stability (CLS).
Where each fits
| Tool | What it gives you | Best for |
|---|---|---|
| Lightest | Synchronised filmstrip-style visual comparison of page loads | Seeing why one page feels slower, and comparing competitors or before/after builds |
| Lighthouse | Lab audit with metrics, diagnostics and a score | Repeatable regression checks in CI or before a release |
| Core Web Vitals | Field metrics from real visitors | Judging actual user experience and search-facing performance |
Lightest and Lighthouse answer different questions. Lighthouse tells you a page scored badly and points at likely causes; Lightest lets you watch the load and spot the cause yourself — a late hero image, a blocked render, a layout shift as a banner drops in. Core Web Vitals sit above both: they are the outcome you are trying to improve, measured on real devices and networks rather than in a controlled run.
A practical way to combine them
- Use Core Web Vitals data to find which templates or pages genuinely underperform for users.
- Reproduce those pages in Lightest, comparing a slow page against a fast one on the same timeline, to isolate the visible moment things go wrong.
- Confirm the cause with a Lighthouse audit, then fix and re-run.
- Return to field data to check whether real users noticed the improvement.
If you want a broader reference point for what "good" looks like, web.dev documents the Core Web Vitals thresholds and how they are measured, and PageSpeed Insights pairs field data with a Lighthouse run for a single URL. For the audit tool itself, see Chrome Developers.
The trade-off is straightforward: Lightest is fast to read and good for persuasion — showing a client or teammate the difference rather than arguing about a number — but it is not a substitute for measurement. A single visual comparison on your machine and network will not tell you what your visitors on mid-range phones experience. Use it to understand and communicate, and keep Lighthouse and field data as your evidence.
What types of websites or use cases can I compare with lightest?
Lightest is built around comparing how pages load on a shared timeline, so the useful question isn't "which sites are allowed?" but "which comparisons produce a decision?" Its own framing is broad: the page lists categories like custom, clouds, AI, ecommerce and news alongside a URL comparison, which signals that any publicly reachable page is fair game — the categories are just starting points, not limits.
Comparisons that tend to be worth running
- Your site against a direct competitor. The clearest use case. Two product pages, two pricing pages, two landing pages, loaded together so you can see which one paints sooner and where the other stalls.
- Your site against itself, before and after a change. A staging URL versus production, or an old version versus a new one. This is where a shared timeline beats a single score, because you can see whether a regression came from images, scripts or a slow server response.
- Two pages on your own site. Homepage versus a heavy category or article page, to find out whether the problem is sitewide or confined to one template.
- Different page types in one industry. An ecommerce product page versus a checkout page; a news article versus a live blog. Useful when you're setting internal budgets for how fast each template should be.
- Competitors against each other. If you're choosing a vendor, a platform or an agency, comparing their own sites side by side tells you what they actually ship, not what they promise.
Who gets the most out of it
Developers and performance engineers will read the filmstrip closely, watching when the largest element appears and when the layout stops shifting. Designers and marketers get more from the visual comparison — the moment a page looks usable rather than blank. Product and marketing leads use it for arguments: showing a stakeholder two side-by-side loads is often faster than explaining a metric.
Practical limits to keep in mind
A comparison is only as fair as its conditions. Network speed, device, location and caching all change results, so run each pair more than once and treat a single run as a hint, not a verdict. Third-party scripts, consent banners and personalised content can also make the same URL behave differently between runs. And a fast-looking filmstrip doesn't capture everything users feel — a page that paints quickly but responds slowly to taps will still frustrate people.
A concrete first step
Pick the one page where speed most affects revenue or sign-ups, then compare it against the closest equivalent page from a competitor you consider fast. Run each three times, note where the gap opens up — first paint, main content, or late-loading elements — and use that single observation to decide what to fix first. If you want a second reference point for how a page behaves under controlled conditions, PageSpeed Insights runs its own lab and field analysis, and WebPageTest lets you vary location and connection type.
Do I need to install anything to use lightest for web performance testing?
No. Lightest is a browser-based tool: you open lightest in your browser and compare page loads on a shared timeline. There is no mention of a desktop app, browser extension or command-line package, so the normal path is simply visiting the site and running a comparison. You will need a reasonably current browser and a stable connection, since the tool loads real pages over the network.
That fits a common workflow: a developer checks a staging URL against the current production page, or a marketer compares a competitor's landing page. If you want to test authenticated or internal pages, a hosted tool cannot reach them without a tunnel or public URL, so plan for that.
If you prefer a local setup, alternatives exist. Google's Lighthouse documentation covers running Lighthouse from Chrome DevTools or as a Node package, and WebPageTest offers hosted testing with advanced scripting. Compare the trade-offs:
| Approach | Setup | Best for |
|---|---|---|
| Lightest | None beyond a browser | Quick side-by-side filmstrip comparisons |
| Browser DevTools / Lighthouse | Bundled with Chrome | Per-page audits and Core Web Vitals |
| WebPageTest | None, but more options | Detailed network and scripting control |
Next step: open Lightest, paste two URLs and compare the filmstrips. If you need repeatable runs in CI, choose a scriptable local tool instead.
 Hosting and Email
 Namecheap
 Hosting
 Vercel
 Location
 United States
 Pages, Search and Sharing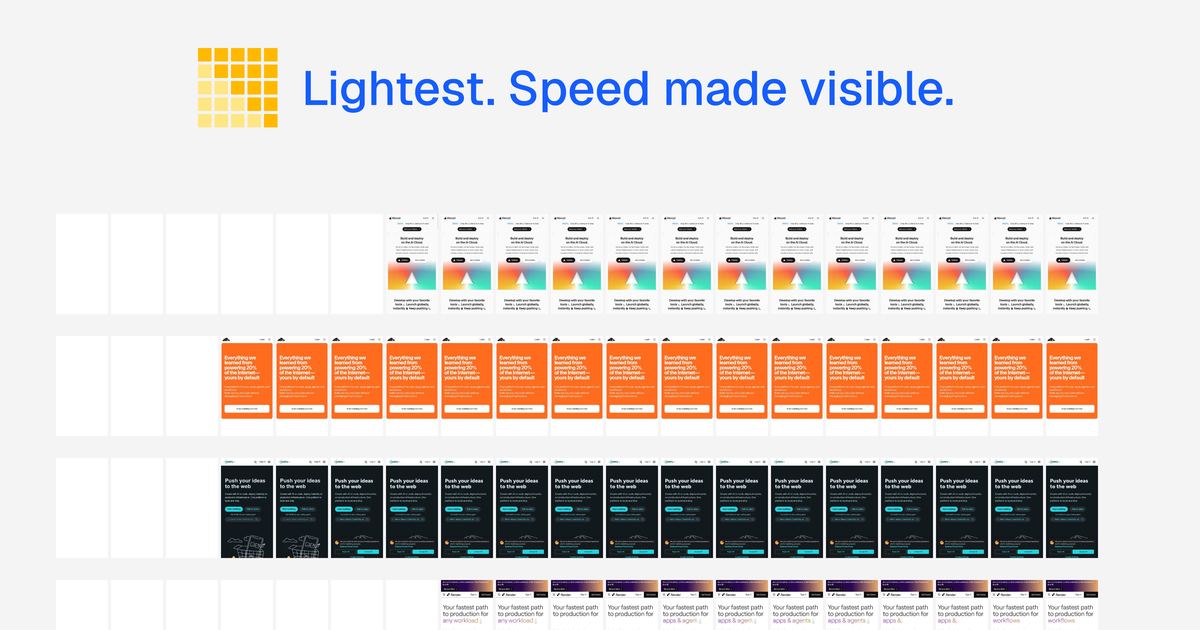



 All bots

 Registration details

 Identified technologies
User reviews (0)