Website profiles · Technology insights · Alternatives

repolog.io

No paid content found

Categories: Marketing Artificial Intelligence

Free website audit in about a minute, no signup. Repolog checks SEO, Core Web Vitals, accessibility, security and AI readiness, and ranks every fix.

Visit website

Updated: 2026-10-04 19:17 Language: English (default) Access: Normal

Profile views 8 Outbound visits 1
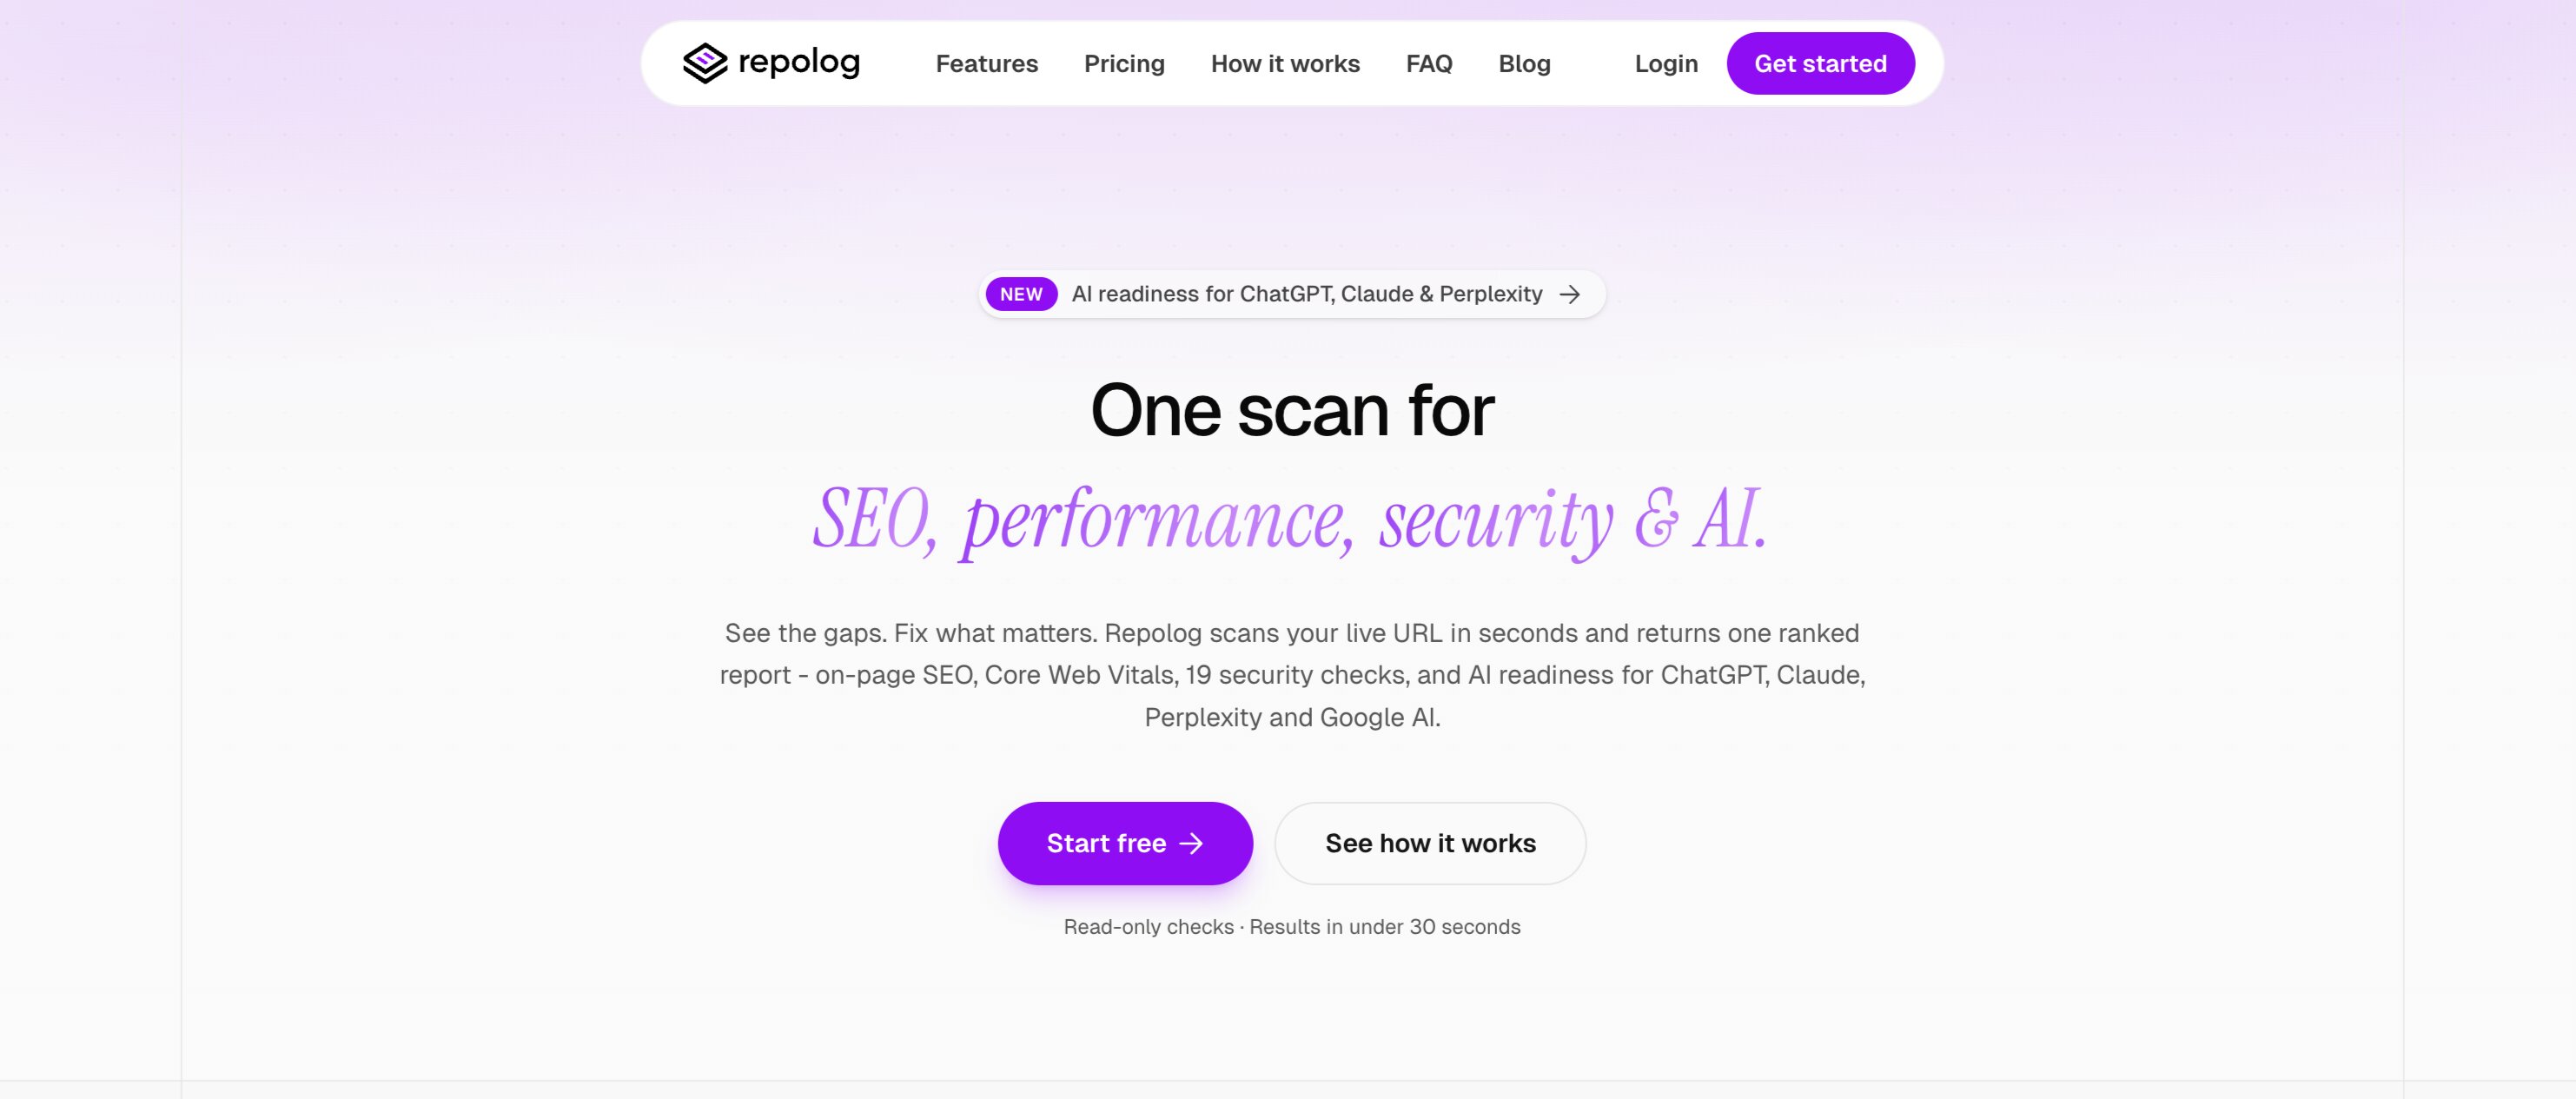
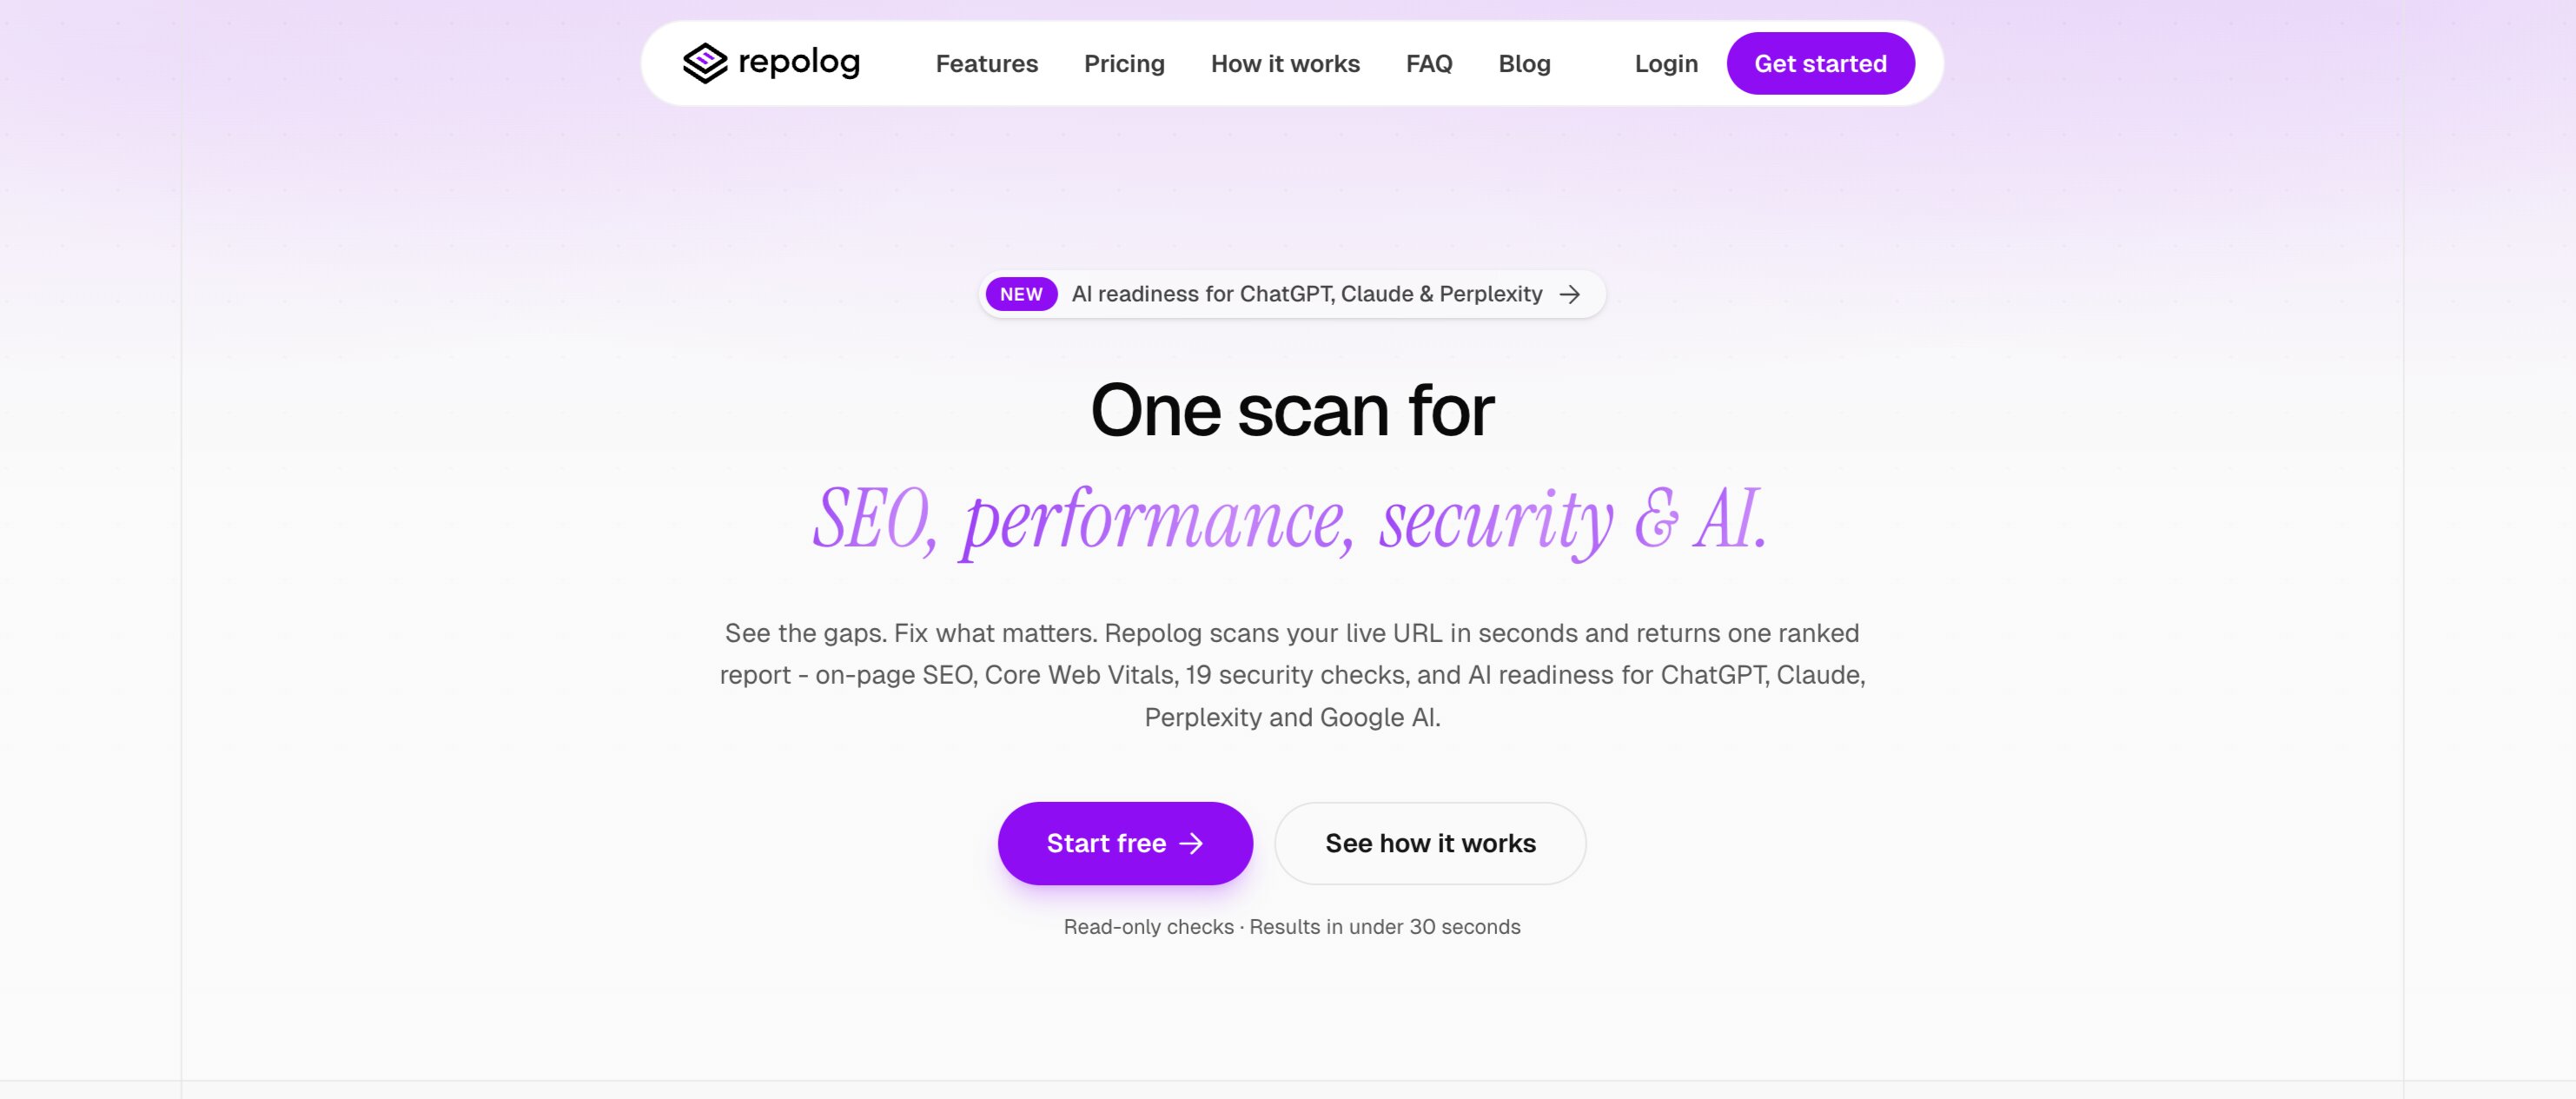
Repolog Full homepage screenshot
Editorial Review

Website Review

What is Repolog?

Repolog is an AI-assisted website audit tool that scans a single page and returns a ranked list of fixes across SEO, performance, accessibility, security, and AI search readiness. You enter a homepage, a headless browser loads it, and 60+ checks run against the live page — typically producing a report in under a minute, with no signup for the first scan.

What one scan actually covers

  • SEO: titles, meta descriptions, heading hierarchy (H1–H6), image alt coverage, Open Graph tags, canonical URLs, plus written analysis with specific fixes.
  • Performance: Core Web Vitals measured via Lighthouse on mobile emulation (FCP, LCP, TBT, CLS, Speed Index), scored against Google's thresholds.
  • Accessibility: axe-core run against the WCAG 2 rule set — contrast, alt text, form labels, landmarks, ARIA roles, focus order — reported down to the failing element.
  • Security: 19 read-only checks for transport and headers (HSTS, CSP, X-Frame-Options and others), HTTPS enforcement, mixed content, and exposed files like .env, .git, or wp-config.php.
  • AI readiness: 18 checks for crawler access (GPTBot, ClaudeBot, PerplexityBot, Google-Extended), JSON-LD structured data, sitemap.xml and llms.txt presence, semantic landmarks, and author/publication metadata.

Who it suits

A solo developer or small marketing team that wants one dashboard instead of juggling a Lighthouse run, an axe scan, a header checker, and a separate SEO crawler. The keyword research module (with Search Console integration and cannibalization flags) matters more to teams already publishing content than to someone fixing a one-off site.

Trade-offs to weigh

  • One homepage per day on the free scan is a trial, not a monitoring workflow; recurring tracking and the 20–100 monthly keyword research runs sit behind the paid tiers.
  • Breadth means shallower depth in any single area than a dedicated specialist tool — treat the security checks as a hygiene screen, not a penetration test.
  • It scans the URL you give it, so it complements rather than replaces a full-site crawl.

Next step: run the free scan on your highest-traffic page first. If the report surfaces quick wins in Core Web Vitals and headers, that page's fixes usually transfer across a templated site; if the issues are content-level, work page by page. If you want a second opinion on the SEO and performance numbers specifically, compare them against PageSpeed Insights.

How do I run a free website audit with Repolog and what does the report include?

Enter your homepage at Repolog and run the free scan — no signup is required, and the report is typically ready in about a minute. The free tier covers one homepage per day. Beyond that, the paid product adds keyword research and tracking, so treat the free scan as a diagnostic rather than an ongoing monitoring setup.

What the free report covers

The scan loads your page in a real headless browser and runs 60+ checks across five areas, each issue ranked with a suggested fix:

  • SEO — titles, meta descriptions, heading hierarchy (H1–H6), image alt coverage, Open Graph tags, canonical URLs, plus a written analysis with specific fixes.
  • Performance — Core Web Vitals from Lighthouse on mobile emulation: FCP, LCP, TBT, CLS and Speed Index, scored against Google's ranking thresholds.
  • Accessibility — axe-core checks against the WCAG 2 rule set, including colour contrast (AA), alt text, form labels, landmark and heading structure, ARIA roles, and keyboard/focus signals, reported down to the failing element.
  • Security — 19 read-only checks across transport, headers and file exposure: HSTS, CSP, X-Frame-Options, HTTPS enforcement, mixed content, exposed .env/.git/wp-config.php, debug endpoints, server version leakage and source maps.
  • AI readiness — 18 checks on how AI crawlers and assistants can read you: robots.txt access for GPTBot, ClaudeBot, PerplexityBot and Google-Extended; JSON-LD structured data; sitemap.xml and llms.txt presence; semantic landmarks; author and publication metadata; FAQ patterns.

A practical way to use it

Run the scan on your homepage first, then work the ranked list from the top rather than fixing everything at once. A sensible first pass:

  1. Fix anything in security that exposes files or credentials — that is urgent regardless of rankings.
  2. Clear Core Web Vitals failures, since LCP and CLS affect both rankings and real user experience.
  3. Fix heading structure and alt text, which serve SEO and accessibility at the same time.
  4. Add or correct structured data and confirm your robots.txt lets the AI crawlers you care about in.

If you manage several sites, the paid tiers add keyword research (20 runs per month on Starter, 100 on Pro, pooled across the workspace), keyword-to-page mapping so each scan grades a page against its target keyword, and a Google Search Console integration that surfaces queries you already get impressions for and flags cannibalisation across pages. If you only want a one-off health check, the free scan is enough; if you want to track whether fixes actually move rankings, you will need the paid side.

For a second opinion on performance specifically, PageSpeed Insights runs the same Lighthouse engine with field data from real Chrome users, which is useful when lab scores and real-user scores disagree.

How does Repolog check whether my site is ready to be cited by AI search engines?

Repolog treats “AI readiness” as its own audit category, separate from classic SEO. Its AI-readiness pass runs 18 checks inside the same headless-browser scan it uses for the rest of the report, then ranks the resulting issues alongside your SEO, performance, accessibility and security findings.

What the AI-readiness checks look at

  • Crawler access in robots.txt — whether GPTBot, ClaudeBot, PerplexityBot and Google-Extended are allowed to fetch your pages. Blocking these bots is the most direct way to make yourself uncitable.
  • Structured data — presence of JSON-LD markup, which helps AI systems identify what your page is about and who published it.
  • Discovery files — sitemap.xml and llms.txt, the latter being a newer convention for describing a site to language models.
  • Semantic HTML landmarks — whether your page structure is machine-readable rather than a wall of divs.
  • Author and publication metadata — signals that a page has a traceable source, which matters for trust and attribution.
  • FAQ patterns — question-and-answer formatting that maps cleanly onto how AI systems quote passages.

Practical read of this

The list is essentially a crawlability-and-extractability checklist, not a ranking predictor. That is a sensible framing: you cannot be cited by an AI answer engine if its crawler is blocked, and you are harder to quote accurately if your content has no clear structure or provenance. A concrete scenario: a site that blocks GPTBot in robots.txt and publishes articles with no author byline and no JSON-LD will fail several of these checks at once, and the fix is a config change plus a template change rather than a rewrite.

Two caveats worth holding onto. First, these checks tell you whether you can be crawled and parsed — they say nothing about whether an AI system will actually choose to cite you, which depends on content quality and competition. Second, llms.txt is a proposed convention, not a standard that all AI vendors honour; treat its absence as a low-priority item rather than a red flag.

Next step

Run the free homepage scan and read only the AI-readiness section first. Fix anything in the crawler-access group before touching the metadata group — an unblocked bot with mediocre markup beats perfect markup behind a blocked bot. If you want to compare how the category is framed elsewhere, Repolog is the tool in question, and general guidance on crawler directives is published by Google Search Central.

What security and accessibility issues can Repolog detect on my website?

Repolog runs accessibility and security checks against the same live page load it uses for the rest of the audit, so both sets of findings come from what a real browser actually renders rather than a static source review.

Accessibility (axe-core, WCAG 2 rule set)

  • Colour contrast failures measured against the AA threshold, reported at the exact failing element
  • Missing or unhelpful image alt text
  • Form fields without labels, and controls without accessible names
  • Landmark and heading structure problems (including heading order)
  • Invalid or misused ARIA roles
  • Keyboard and focus-order signals

Because results are element-level, a developer can jump straight to the offending node instead of guessing which component is at fault. Practical use: run the free homepage scan after a design-system change, then re-scan to confirm the fixes landed.

Security (19 read-only checks)

  • Transport and headers: HSTS, CSP, X-Frame-Options and roughly six other header checks
  • HTTPS enforcement and mixed-content detection
  • Exposed sensitive files such as .env, .git and wp-config.php
  • Reachable debug endpoints and admin panels
  • Server version and tech-stack leakage
  • Source map accessibility

These are non-intrusive checks — the page is loaded and inspected, not attacked — so a clean result is a hygiene baseline rather than a penetration test. The exposed-file and debug-endpoint findings are the ones worth acting on first, since they can hand an attacker a direct route in.

How to decide what to fix first

Both categories arrive in the same ranked report, so you can weigh them against SEO and performance issues rather than treating accessibility and security as separate projects. A sensible order for most sites:

  1. Exposed files, debug endpoints and HTTPS/mixed-content problems — fastest to fix, highest downside if ignored
  2. Contrast and form-label failures — often a small CSS or markup change that clears many elements at once
  3. Header hardening (HSTS, CSP) — needs a server or CDN config change, so it takes longer

Next step: scan your homepage at Repolog without signing up, then open the accessibility section and sort by element count — the component with the most failures is usually the cheapest single fix on the page.

How does Repolog's keyword research and Search Console integration help me decide which pages to fix?

Repolog ties keyword data to a specific page and then re-grades that page against the keyword you assigned it, so the tool pushes you toward a page-level decision rather than a site-wide to-do list.

How the loop works

  1. Run keyword research: Repolog reports search volume, difficulty, and CPC per country market.
  2. Map each keyword to the page you believe should rank for it.
  3. The next scan grades that page against its assigned keyword.
  4. The Google Search Console integration shows queries where you already earn impressions and flags keywords cannibalized across multiple pages.

The practical value is the pairing of "what you want to rank for" with "what Google already shows you for." Impressions without clicks usually mean the page is eligible but underperforming — a title, intent, or content-depth problem. Cannibalization flags mean two or more of your pages compete for the same query, so consolidating or re-targeting beats rewriting both.

A concrete scenario

Say you have a pricing page and a blog post both getting impressions for "seo audit cost." Repolog's cannibalization flag tells you they overlap. The keyword mapping tells you which one you intended to own the term. The page-level grade then tells you whether the intended page has the on-page basics (title, meta, heading hierarchy, structured data) to actually win it. You fix the intended page and re-point or prune the other — instead of editing both blindly.

Decision criteria

Signal What it suggests
Impressions, low clicks, page grades well Snippet or intent mismatch — rewrite title/meta, check search intent
Impressions, low clicks, page grades poorly On-page fixes first, then re-measure
Same keyword across multiple pages Consolidate, canonicalize, or differentiate by intent
Keyword with volume but no mapped page Content gap — create or repurpose a page
Keyword mapped to a page with no impressions Wrong page, wrong intent, or too new to rank

Trade-offs to weigh

Keyword research and Search Console data describe demand and current visibility; they do not tell you whether a page's content is genuinely better than competitors'. Repolog's grading is on-page and technical, so treat its score as a floor, not a verdict. Also note that research runs are metered — Starter includes 20 per month and Pro 100, pooled across the workspace — so spend runs on decisions you will act on rather than curiosity queries.

Next step

Pick your five highest-impression, lowest-click queries from Search Console, confirm each has exactly one mapped page, and fix the weakest-graded one first. Re-scan after changes to see whether the grade and the click-through move together.

Repolog is at Repolog.

How does Repolog compare to other SEO audit tools and what do the free and paid plans cost?

Repolog bundles five audit types into one scan — SEO, Core Web Vitals, accessibility, security and AI readiness — and ranks each finding by what to fix first. That single-report approach is its main difference from tools that specialize in one area.

How it differs from other audit tools

Tool Strength Where Repolog differs
Repolog One ranked report across SEO, performance, accessibility, security and AI readiness Bundles categories usually split across separate tools
Google Lighthouse Free performance, accessibility and SEO scoring in Chrome No AI-search checks, no ranked fix list across security
Ahrefs Backlink index, keyword data, rank tracking Repolog's keyword research is smaller in scope
Screaming Frog Deep desktop crawling of large sites Repolog is browser-based, no install
Semrush Broad marketing suite, PPC and content tooling Repolog is narrower and audit-focused

The practical split: if you need backlink analysis or multi-channel marketing, a suite tool wins. If you want a fast pass on whether a page is technically sound and citable by AI assistants, Repolog covers ground those tools mostly don't.

Free vs paid

The free audit runs one homepage per day with no signup and returns the full ranked report. That's enough to evaluate a single site or test the tool before committing.

Paid plans add the parts that require stored data: keyword tracking, mapping keywords to target pages, and Google Search Console integration that surfaces queries you already get impressions for and flags cannibalization across pages. Keyword research runs are pooled across a workspace — 20 per month on Starter, 100 on Pro. A 7-day free trial starts with no payment due today.

Choosing

Run the free scan on your homepage first. If the ranked fixes are useful and you need ongoing tracking plus Search Console data, the trial tells you whether the paid tier earns its place. If you mainly need backlinks or paid-search data, keep a suite tool alongside it rather than replacing one with the other.

Related questions

More questions →
What Is an SEO Audit and What Does It Actually Check?

An SEO audit is a structured pass over your site that checks whether search engines can crawl, understand, and rank your pages — and it usually bundles in performance, accessibility, and security checks that affect how your site is experienced and trusted. You run one when you want a prioritized list of fixes rather than a vague sense that "SEO needs work." The catch: an audit tells you what's broken, not what to write or who should link to you.

The categories a scan typically covers

A modern audit isn't just meta tags. Tools like Repolog run 60+ checks in a single headless-browser load, grouped into five areas:

Category What gets checked Why it matters
SEO / on-page Titles, meta descriptions, H1–H6 hierarchy, image alt coverage, Open Graph tags, canonical URLs Tells search engines what each page is about and which URL is authoritative
Performance Core Web Vitals from Lighthouse (FCP, LCP, TBT, CLS, Speed Index) on mobile emulation Google uses these as ranking signals; slow pages lose both rankings and visitors
Accessibility axe-core against the WCAG 2 rule set: color contrast (AA), alt text, form labels, landmarks, ARIA roles, focus order Affects real users and increasingly factors into quality assessments
Security 19 read-only checks: HSTS, CSP, X-Frame-Options, HTTPS enforcement, mixed content, exposed .env/.git/wp-config.php, debug endpoints, server version leakage Exposed files and missing headers erode trust and can get you flagged
AI readiness 18 checks: robots.txt access for GPTBot, ClaudeBot, PerplexityBot, Google-Extended; JSON-LD structured data; sitemap.xml and llms.txt presence; author/publication metadata; FAQ patterns Determines whether AI search tools can read and cite your content

If your goal is only classic Google rankings, the first two rows carry the most weight. The last row matters if you want visibility in AI-generated answers, which is a separate channel with separate rules.

How a scan actually runs

The mechanics are simpler than the output suggests:

  1. Add your site — enter a domain or import sites you already manage. No install, no code changes, no SDK.
  2. Run the scan — a real headless browser loads your page and the checks execute against that live render. This is why performance and accessibility results reflect what a browser actually sees, not just raw HTML.
  3. Read the ranked report — every issue comes with its fix, ordered by impact. A full report typically arrives in about a minute.

The key detail is "live browser load." Checks that run against static HTML miss JavaScript-injected content, layout shifts, and focus-order problems. A headless render catches them.

How to read the results and prioritize

Don't work top-to-bottom through the list. Sort by what blocks indexing or ranking first:

  • Crawl/index blockers — robots.txt rules blocking the wrong bots, canonical URLs pointing to the wrong page, noindex tags. Fix these before anything else; nothing downstream matters if the page can't be indexed.
  • Core Web Vitals failures — LCP and CLS problems on your highest-traffic templates. Fix the template, not individual pages.
  • On-page gaps — missing or duplicate titles, broken heading hierarchy, missing alt text. Fast to fix, moderate ranking impact.
  • Security and accessibility — exposed config files and contrast failures. Lower direct ranking impact but real trust and usability costs.
  • AI readiness — only worth prioritizing if AI search visibility is a goal for you.

A ranked report does this ordering for you, but you should still sanity-check it against your own traffic data. A "critical" issue on a page nobody visits is less urgent than a "warning" on your top landing page.

One-time audit vs. ongoing monitoring

A single audit is a snapshot. Sites change — you publish, redesign, add scripts, change headers. Two things make an audit useful over time:

  • Keyword tracking tied to pages — map each target keyword to the page that should rank for it, then re-scan to grade that page against its keyword. This turns a static report into a feedback loop.
  • Search Console integration — surfaces queries you already get impressions for and flags keywords cannibalized across multiple pages, which a one-time crawl can't see.

Repolog's keyword research includes real search volume, difficulty, and CPC per country market, with 20 research runs/month on Starter and 100 on Pro, pooled across the workspace. That's the ongoing layer; the scan is the diagnostic layer.

What an audit can't do

Be clear about the boundary:

  • It can't fix content quality. A page can pass every technical check and still not rank because it doesn't answer the query well.
  • It can't build backlinks. Off-page authority is outside any on-page scan.
  • It can't tell you which keyword to target. It can grade a page against a keyword you've chosen, but the strategic choice is yours.
  • It can't guarantee rankings. It removes obstacles; it doesn't create demand.

Treat the audit as a checklist that clears the path, not as the thing that does the walking.

Deciding whether to run one

Run an audit if you've never done one, if you've redesigned or migrated recently, or if rankings dropped without an obvious cause. Repolog offers a free homepage scan — one homepage per day, no signup — which is enough to see whether technical issues are holding you back. If you need ongoing tracking, keyword research, and multi-site management, the paid tier starts with a 7-day free trial. Start with the free scan; only move to a paid plan once you've confirmed there's a backlog of fixes worth tracking over time.

What Is Google Lighthouse and What Does Its Report Actually Tell You?

Google Lighthouse is an open-source automated auditing tool that loads a page in a real (headless) browser and scores it across five categories: Performance, Accessibility, Best Practices, SEO, and PWA. You run it from Chrome DevTools, the command line, or through PageSpeed Insights, and you get a report in roughly under a minute. It is most useful as a single-page diagnostic: it tells you what is slow or broken on that URL and what to change. It is not a site-wide crawler, so if you need to audit many pages at once, pair it with a broader audit platform.

Where Lighthouse runs

Entry point Best for Notes
Chrome DevTools (Lighthouse panel) Ad-hoc checks on the page you're viewing Runs against your local session, including pages behind a login
PageSpeed Insights Quick public check plus field data Combines lab (Lighthouse) scores with real-user CrUX data when available
Lighthouse CLI / Node module Scripting, CI, repeatable runs Lets you fix throttling and run the same config every time

All three use the same underlying audit engine, so the category list and metric definitions are consistent. What differs is the environment and whether you get real-user data alongside the lab run.

The five categories

  • Performance — how fast the page renders and how stable it is, scored from lab metrics.
  • Accessibility — automated checks against WCAG rules: color contrast, alt text, form labels, heading and landmark structure, ARIA roles, focus order.
  • Best Practices — general web hygiene: HTTPS, safe libraries, correct image aspect ratios, console errors.
  • SEO — basic on-page signals: title, meta description, crawlability, legible font sizes, tap target spacing.
  • PWA — installability and offline behavior. Only relevant if you're building a progressive web app; most sites can ignore it.

How the Performance score is built

The Performance number is a weighted blend of lab metrics, not a direct measurement of "speed." The core ones:

  • FCP (First Contentful Paint) — when the first text or image appears.
  • LCP (Largest Contentful Paint) — when the main content element finishes rendering. Usually the heaviest-weighted metric.
  • TBT (Total Blocking Time) — how long the main thread is blocked by long tasks, which delays interactivity.
  • CLS (Cumulative Layout Shift) — how much visible content jumps around during load.
  • Speed Index — how quickly content is visually populated.

Each metric is compared against Google's thresholds and mapped to a 0–100 sub-score, then the sub-scores are combined with fixed weights. That's why two pages with the same LCP can still score differently — TBT or CLS can drag one down.

Reading the report and prioritizing fixes

Work top-down by impact, not by the order audits are listed:

  1. Start with the metric that scored worst. If LCP is red, fix the largest element (usually a hero image or heading). If TBT is red, look for long JavaScript tasks.
  2. Read the "Opportunities" section. These are estimated savings — e.g. "Properly size images," "Eliminate render-blocking resources," "Reduce unused JavaScript." Each one links to the exact elements involved.
  3. Check "Diagnostics" for context the opportunities don't cover, like DOM size or main-thread work breakdown.
  4. Fix accessibility and SEO items in the same pass. They're usually cheap: missing alt text, low contrast, a missing meta description.

The report tells you what failed and points at the elements; it does not rewrite your code. Treat each failing audit as a task with a specific target.

Why scores vary between runs

Lighthouse is a lab tool, so results depend on the run conditions:

  • Throttling — default mobile emulation simulates a slow 4G connection and a mid-tier CPU. Change it and the score changes.
  • Third-party scripts — ads, analytics, and A/B tools load inconsistently and can swing TBT.
  • Server response time — a slow backend on one run inflates FCP and LCP.
  • Browser extensions and local state — DevTools runs can be affected by what's loaded in your session.

To get consistent numbers: run the CLI with a fixed config, run several times and compare the median, and test in a clean profile or CI environment rather than your daily browser.

When Lighthouse isn't enough

Lighthouse audits one URL per run. It won't tell you that 40 of your 500 pages share the same broken template, and it doesn't track whether a fix held after the next deploy. For that you need a tool that crawls the whole site and re-checks over time.

For example, a platform like Repolog runs a headless browser against your page and executes 60+ checks in one pass — SEO, Core Web Vitals pulled from Lighthouse (FCP, LCP, TBT, CLS, Speed Index on mobile emulation), accessibility via axe-core against the WCAG 2 rule set, 19 read-only security checks, and AI-readiness checks (robots.txt access for GPTBot, ClaudeBot, PerplexityBot and Google-Extended, JSON-LD structured data, sitemap.xml and llms.txt presence). The practical difference is scope and workflow: Lighthouse gives you a deep single-page lab report; a multi-page audit tool gives you coverage and a ranked fix list across the site.

A sensible split: use Lighthouse while you're actively fixing a specific page, and a site-wide audit when you need to know which pages to fix first or confirm a fix stuck.

What Are Core Web Vitals and How Do You Measure and Improve Them?

Core Web Vitals are three metrics Google uses to measure real page experience: LCP (loading), INP (interactivity), and CLS (visual stability). Each has published thresholds — good, needs improvement, poor — and each maps to a small set of common causes with known fixes. You measure them two ways: lab data from a tool like Lighthouse (a simulated run) and field data from real visitors (Chrome UX Report, Search Console). Lab data tells you what to fix; field data tells you whether it worked.

The three metrics and what each one measures

Metric Full name What it measures Good Needs improvement Poor
LCP Largest Contentful Paint Time until the largest visible element (hero image, heading, video poster) renders ≤ 2.5s 2.5–4.0s > 4.0s
INP Interaction to Next Paint Responsiveness across all interactions — the delay between a click/tap/keypress and the next visual update ≤ 200ms 200–500ms > 500ms
CLS Cumulative Layout Shift How much visible content moves unexpectedly during load ≤ 0.1 0.1–0.25 > 0.25

INP replaced FID (First Input Delay) as the interactivity metric. FID only measured the delay before the browser started processing the first interaction; INP samples interactions across the whole visit and reports a high-percentile value, so it catches slow responses that FID missed. If you see FID in older reports, treat INP as the current target.

Thresholds are evaluated at the 75th percentile of page loads, segmented by mobile and desktop. A page passes only when 75% of real visits hit the "good" band for all three metrics.

How to measure: lab data vs. field data

These answer different questions, and you need both.

Lab data (Lighthouse, PageSpeed Insights' "Analyze" tab) — a single simulated load on a throttled connection. It's reproducible, so it's good for debugging and for comparing before/after a fix. It is not what your users experience.

Field data (Chrome UX Report via PageSpeed Insights' top section, or Search Console's Core Web Vitals report) — aggregated from real Chrome users over the past 28 days. This is what Google's ranking systems actually see. It can be empty for low-traffic pages, in which case you have no field signal yet.

A practical workflow:

  1. Run PageSpeed Insights on the URL. Read the field data first — if the page passes in the field, lab warnings are lower priority.
  2. If field data is failing or missing, use the Lighthouse section to find the specific cause.
  3. Fix, deploy, then re-check field data after the 28-day window rolls over. Lab scores update immediately; field data does not.

Repolog runs Core Web Vitals from Lighthouse (FCP, LCP, TBT, CLS, Speed Index) on mobile emulation inside a real headless browser load, scored against Google's thresholds, and returns a ranked report in about a minute with no signup — one homepage per day on the free scan. That's useful for a fast baseline; you still want field data to confirm real-world impact.

Common causes and fixes

LCP is slow

The usual culprits, in rough order of frequency:

  • The LCP element is an unoptimized image. Serve it as WebP/AVIF, size it correctly, and add fetchpriority="high" to the hero image. Don't lazy-load the LCP image.
  • Render-blocking CSS or fonts. Inline critical CSS, defer the rest, and preload the primary font file.
  • Slow server response (high TTFB). LCP can't be faster than the server's first byte. Check caching, CDN coverage, and database queries on the critical path.
  • Client-side rendering. If the hero content only appears after a JS bundle executes, the browser paints late. Server-render or statically generate the above-the-fold content.

INP is high

  • Long tasks on the main thread. Break up JavaScript that runs for more than 50ms; yield to the browser between chunks.
  • Heavy third-party scripts — tag managers, chat widgets, analytics. Load them after interaction or in a worker where possible.
  • Expensive event handlers. Debounce input handlers and avoid layout reads/writes inside them.

CLS is high

  • Images and iframes without dimensions. Always set width and height (or an aspect-ratio box) so the browser reserves space.
  • Ads, embeds, and banners injected above existing content. Reserve a fixed slot.
  • Web fonts swapping and reflowing text. Use font-display: optional or swap with a matched fallback metric.
  • Late-injected DOM (cookie bars, promos) that pushes content down. Overlay instead of inserting into flow.

Where Core Web Vitals fit in a broader audit

Core Web Vitals are one input among several, and they interact with the rest. A page can pass all three metrics and still fail on SEO fundamentals (missing titles, broken heading hierarchy, no canonical), accessibility (contrast, form labels, ARIA), or security (missing HSTS, exposed .env). Repolog's scan bundles these: 60+ checks across SEO, performance, accessibility (axe-core against WCAG 2 rules, reported to the failing element), security (19 read-only checks including header and file-exposure tests), and AI readiness (18 checks covering GPTBot/ClaudeBot/PerplexityBot access in robots.txt, JSON-LD, sitemap.xml, llms.txt, and FAQ patterns). Each issue comes with its fix.

The reason to look at them together: a fix for one can regress another. Deferring a script to improve INP can delay the LCP element. Adding a consent banner for compliance can introduce CLS. Running the checks in the same browser load, as Repolog does, makes those trade-offs visible in one report instead of three.

Quick decision guide

  • Just want to know if you pass? PageSpeed Insights field data, or Search Console's Core Web Vitals report.
  • Need to debug a specific failing metric? Lighthouse in Chrome DevTools, with the performance trace open.
  • Want a ranked list of everything to fix across SEO, speed, accessibility, security, and AI readiness, with the fix attached? Run a scan on your homepage — Repolog's free audit takes about a minute with no signup, and the paid tiers (7-day free trial, $0 due today) add keyword research runs, keyword-to-page mapping, and Search Console integration for cannibalization checks.
What Does a Website Audit Actually Check and How Do You Use the Results?

A website audit runs a set of automated checks against a live page and returns a ranked list of issues, each paired with a fix. On Repolog, one scan covers five areas — SEO, performance (Core Web Vitals), accessibility, security, and AI readiness — in about a minute, with no signup required for a single homepage scan. You use the results by working top-down through the ranking rather than trying to fix everything at once. This applies to any site you can point a scanner at; it does not require code changes, an SDK, or installing anything.

The five areas one scan covers

Each area answers a different question about the same page load.

Area What it checks Example signals
SEO On-page structure and metadata Titles, meta descriptions, heading hierarchy (H1–H6), image alt coverage, Open Graph tags, canonical URLs
Performance Real Core Web Vitals from Lighthouse on mobile emulation FCP, LCP, TBT, CLS, Speed Index, scored against Google's ranking thresholds
Accessibility axe-core run inside the same live browser load against WCAG 2 rules Color contrast (AA), alt text, form labels and accessible names, landmark and heading structure, ARIA roles, keyboard and focus-order signals
Security 19 read-only checks across transport, headers, and file exposure HSTS, CSP, X-Frame-Options and 6 more; HTTPS enforcement and mixed content; leaked .env / .git / wp-config.php; debug endpoints and admin panels; server version and tech-stack leakage; source map accessibility
AI readiness 18 checks for how AI crawlers and answer engines can read the page robots.txt access for GPTBot, ClaudeBot, PerplexityBot, Google-Extended; JSON-LD structured data; sitemap.xml and llms.txt presence; semantic HTML landmarks; author and publication metadata; FAQ patterns

Accessibility findings are reported down to the exact failing elements, which is what makes them actionable — you get the element, not just the rule name.

How a scan works in practice

  1. Add your website. Enter a domain, or import sites you already manage. Nothing to install, no code changes, no SDK.
  2. Run a scan. A real headless browser loads your page and 60+ checks run against it. The full report typically returns in under a minute.
  3. Read the ranked report. Issues come back ordered, and every issue includes its fix.

The important detail is the headless browser: checks run against a real rendered page load, not a static HTML fetch. That is why performance and accessibility numbers reflect what a visitor's browser actually does.

How to prioritize the fixes

The ranking exists so you don't have to guess. A practical order:

  • Fix anything that blocks indexing or crawling first. Canonical errors, robots.txt rules that lock out search or AI crawlers, and broken heading structure affect everything downstream.
  • Then take the Core Web Vitals that are failing Google's thresholds. LCP and CLS tend to have the widest blast radius across rankings and user experience.
  • Then accessibility failures with a specific failing element. Contrast and missing form labels are usually quick, bounded fixes.
  • Then security headers and file exposure. Leaked .env, .git, or wp-config.php and exposed debug endpoints are worth treating as urgent even if they rank lower, because they are exposure rather than polish.
  • Then AI readiness. Structured data, sitemap, llms.txt, and crawler access determine whether AI answer engines can cite you at all.

Re-scan after each batch. Because the report is ranked, the next scan shows whether your fix moved the issue or just changed its position.

When a free one-page scan is enough — and when it isn't

A free homepage scan (one per day, no signup) is enough when you want to:

  • Sanity-check a single page before or after a redesign
  • Confirm whether a specific problem (slow LCP, contrast failures, a missing sitemap) exists
  • Evaluate the tool before committing

You need more than a one-page scan when the work becomes ongoing:

  • Multi-page coverage. Issues on category, product, or article templates won't appear in a homepage scan.
  • Keyword tracking. Repolog maps each tracked keyword to the page that should rank it, and the next scan grades that page against its keyword. Starter includes 20 research runs per month, Pro 100, pooled across the workspace.
  • Search Console integration. This surfaces queries you already get impressions for and flags keywords cannibalized across multiple pages — something a single scan can't see.
  • Team use. Importing sites you already manage and pooling research runs across a workspace implies more than one person or property.

Repolog offers a 7-day free trial with $0 due today for the signed-up product; the single homepage scan is the no-signup path. Pricing beyond the trial and the Starter/Pro research-run limits isn't specified in the available material, so check the pricing page before assuming a tier fits.

The short version

An audit checks five things — SEO structure, Core Web Vitals, WCAG accessibility, security exposure, and AI crawler readiness — against a real browser load, then ranks the findings. Use the ranking: fix crawl and indexing blockers, then failing vitals, then element-level accessibility issues, then security exposure, then AI readiness. Start with the free single-page scan; move to tracking and Search Console integration once you're fixing templates and keywords rather than one page.

What Can You Actually Do With Free SEO Tools?

Free SEO tools can handle a surprising amount of real work: checking backlinks, auditing on-page elements, tracking keyword positions, and generating reports. For a small site or a beginner, they cover most day-to-day tasks. The catch is not capability but capacity — free tools usually limit how much data you can pull, how often you can pull it, and how precisely you can filter it. Understanding those limits lets you decide what to do for free and when paying becomes the sensible next step.

Mapping Common SEO Tasks to Free Tool Coverage

Most SEO work falls into a handful of recurring jobs. Here is how free tools typically perform on each.

Task What free tools usually give you Where they fall short
Backlink checking Total backlink count, referring domains, a sample of linking pages, basic anchor text Full link lists, historical link loss, spam scoring at scale
Keyword position tracking Manual checks, a limited number of tracked keywords, periodic updates Daily or real-time tracking, large keyword sets, competitor comparison
On-page audit Title, meta description, headings, word count, basic readability Site-wide crawling, duplicate content across hundreds of pages
Technical checks Page speed snapshots, mobile-friendliness, broken link scans on single pages Full crawl budgets, log file analysis, JavaScript rendering issues
Content checks Plagiarism scanning, grammar, word frequency Bulk processing, API access, team collaboration
Domain metrics A single authority-style score per domain The underlying data, score history, competitor benchmarking

The pattern is consistent: free tools answer "what is roughly true right now" well, and "what exactly changed over time" poorly.

The Practical Limits You Will Hit

Free tools are not crippled versions of paid ones by accident. The limits exist because crawling, storing, and serving link and ranking data is expensive. Expect these constraints:

  • Usage caps. A fixed number of queries per day, or a character/word limit on content tools. Once you hit the cap, you wait.
  • Sampled data. Backlink checkers often show a subset of links rather than the complete profile. Two tools can report very different totals for the same site, and both can be "correct" within their own index.
  • Delayed or cached results. Ranking positions and link counts may be days or weeks old. Nothing free is truly real-time at scale.
  • Fewer export and filtering options. You may see results on screen but not be able to download them, sort by multiple columns, or filter out low-quality links.
  • No saved history. Without stored snapshots, you cannot see whether a metric improved or declined over the past month.

None of this makes free tools useless. It means you should treat their output as a directional signal, not a precise measurement.

How to Read Backlink Counts and Authority Scores

Two numbers cause the most confusion: backlink count and domain authority-style scores.

Backlink counts vary by index. If one tool says 400 links and another says 1,200, the difference is usually coverage, not error. Use a single tool consistently so your own trend line is comparable, and treat the absolute number as approximate.

Authority scores (often labeled DA, DR, or similar) are third-party estimates, not metrics search engines publish. They compress many signals into one number. That makes them convenient for quick comparison and dangerous as a sole decision criterion. A high score does not guarantee rankings, and a low score does not mean a page cannot rank for a specific query.

A safer habit: look at three things together — referring domains (more meaningful than raw link count), the relevance of linking sites to your topic, and whether your own score is trending up or down over time.

A Simple Free-Tool Workflow for a Small Site

This loop works for a blog, a local business site, or a small store. It assumes you have no budget and limited time.

  1. Audit. Run your key pages through an on-page checker. Record the title, meta description, H1, word count, and any missing alt text in a simple spreadsheet.
  2. Fix. Correct the obvious issues first: duplicate or missing titles, thin content, broken internal links, slow-loading images. These are the highest-return fixes and cost nothing.
  3. Track. Pick 10–20 keywords that matter. Check their positions weekly with a free tracker or manually, and log the date and position.
  4. Compare. Once a month, check referring domains and your authority-style score. Note the direction, not the exact figure.
  5. Repeat. Re-audit pages that lost positions or gained traffic. Update content rather than adding new pages endlessly.

Keep one spreadsheet with three tabs: pages, keywords, and links. Consistency matters more than tool choice.

When a Task Has Outgrown Free Tools

Consider paying when one of these becomes true:

  • You need to track more keywords than the free cap allows, or you need daily updates.
  • You must export full backlink lists for outreach or disavow work.
  • You are auditing a site with hundreds or thousands of pages and need a complete crawl.
  • You need historical data to prove whether a change worked.
  • Multiple people need to work in the same tool with shared access.

Until then, free tools plus a disciplined spreadsheet will carry a small site a long way.

Common Pitfalls to Avoid

  • Trusting one metric. No single score decides rankings. Combine authority, relevance, and traffic data.
  • Expecting real-time rankings. Free trackers lag. Judge trends over weeks, not hours.
  • Comparing across tools. Different indexes produce different numbers. Pick one and stay with it.
  • Chasing link counts. Ten relevant links from real sites beat a thousand low-quality ones.
  • Skipping the fix. Auditing without acting is just collecting data. The value is in the changes you make.

Free SEO tools are genuinely useful for auditing, tracking, and learning. Their limits are about scale and precision, not usefulness. Start with the workflow above, watch your trend lines, and upgrade only when a specific task clearly demands more than the free tier provides.

Website Overview

Page metadata, canonical configuration and social previews work together to provide more consistent search and sharing presentation.

Domain and Registration

Transfer-protection status is present, helping reduce the risk of unauthorized domain transfers. The domain has about 1 years of registration history; its current configuration provides more context than age alone. The registrar is Cloudflare, Inc, a widely used domain service provider. The domain uses the common .io extension, which is not an independent safety signal.

DNS and Email

Nameservers are provided by Cloudflare, indicating managed DNS hosting. MX records point to the Cloudflare Email Routing email service. DNSSEC is enabled, allowing validating resolvers to authenticate signed DNS data. No CNAME was found; the observed records resolve directly to addresses. SPF and DMARC are configured. DKIM status is unknown.

TLS and Certificates

The public key uses EC with 256 bits. The server supplied a complete certificate chain. No organization name is present in the certificate; the available fields are consistent with domain validation. The certificate was issued within the Google Trust Services cloud or CDN ecosystem. The certificate's total validity is about 90 days, consistent with a short renewal cycle.

HTTP and Browser Security

No X-Powered-By header was found, reducing one common source of backend fingerprinting information. All six checked browser-security headers are present. Their effectiveness still depends on the policy values and application behavior. The cf-ray response header indicates a CDN or caching proxy in the delivery path. No obvious internal addresses or debug information were found in the headers. The Server header identifies cloudflare without an exact version.

Technology Stack Analysis

The public page identifies Cloudflare without precise versions, leaving fewer clues for version-specific scanning.

Search and Social Sharing

Twitter Card metadata is configured. JSON-LD includes Organization data, helping describe the organization as an entity. The title has 42 characters, within a common display range. A meta description is present, with 148 characters. The observed directives allow indexing and link following.

Hosting and Email

DNSCloudflare
HostingCloudflare
EmailCloudflare Email Routing
Location Location unknown 104.21.53.71

User reviews (0)

  • No reviews yet.

Pages, Search and Sharing

Meta descriptionFree website audit in about a minute, no signup. Repolog checks SEO, Core Web Vitals, accessibility, security and AI readiness, and ranks every fix.
Canonical URLhttps://repolog.io/
LanguageEnglish (default)
Twitter Cardsummary_large_image
All bots 1 allowed · 2 disallowed
  • Allow/
  • Disallow/api/
  • Disallow/dashboard/
gptbot 1 allowed · 2 disallowed
  • Allow/
  • Disallow/api/
  • Disallow/dashboard/
oai-searchbot 1 allowed · 2 disallowed
  • Allow/
  • Disallow/api/
  • Disallow/dashboard/
chatgpt-user 1 allowed · 2 disallowed
  • Allow/
  • Disallow/api/
  • Disallow/dashboard/
claudebot 1 allowed · 2 disallowed
  • Allow/
  • Disallow/api/
  • Disallow/dashboard/
claude-web 1 allowed · 2 disallowed
  • Allow/
  • Disallow/api/
  • Disallow/dashboard/
anthropic-ai 1 allowed · 2 disallowed
  • Allow/
  • Disallow/api/
  • Disallow/dashboard/
perplexitybot 1 allowed · 2 disallowed
  • Allow/
  • Disallow/api/
  • Disallow/dashboard/
perplexity-user 1 allowed · 2 disallowed
  • Allow/
  • Disallow/api/
  • Disallow/dashboard/
google-extended 1 allowed · 2 disallowed
  • Allow/
  • Disallow/api/
  • Disallow/dashboard/
applebot-extended 1 allowed · 2 disallowed
  • Allow/
  • Disallow/api/
  • Disallow/dashboard/
ccbot 1 allowed · 2 disallowed
  • Allow/
  • Disallow/api/
  • Disallow/dashboard/
meta-externalagent 1 allowed · 2 disallowed
  • Allow/
  • Disallow/api/
  • Disallow/dashboard/

Registration details RDAP / WHOIS

RegistrarCloudflare, Inc
Registered2025-07-25
Expires2027-07-25
Domain statusclientTransferProhibited https://icann.org/epp#clientTransferProhibited
Nameserversarmando.ns.cloudflare.com、vivienne.ns.cloudflare.com
DNSSECsigned

DNS records

TypeNameValueTTLPriority
Arepolog.io104.21.53.71300—
Arepolog.io172.67.209.175300—
AAAArepolog.io2606:4700:3031::6815:3547300—
AAAArepolog.io2606:4700:3031::ac43:d1af300—
MXrepolog.ioroute1.mx.cloudflare.net30072
MXrepolog.ioroute3.mx.cloudflare.net30073
MXrepolog.ioroute2.mx.cloudflare.net30076
NSrepolog.ioarmando.ns.cloudflare.com86400—
NSrepolog.iovivienne.ns.cloudflare.com86400—
TXTrepolog.iogoogle-site-verification=J3kUdLIHrfRWvbujDT20qvbhZtb-PLI6X_CJfOpPmME300—
TXTrepolog.iov=spf1 include:_spf.mx.cloudflare.net ~all300—
DSrepolog.io2371 13 2 dd159f5bb15808da097285b20ea3a6fdadfd0207b610a7174a91dd7c650f3f243600—
DMARC_dmarc.repolog.iov=DMARC1; p=reject; sp=reject; adkim=s; aspf=s; rua=mailto:[email protected];300—

TLS and certificates

AssessmentNormal configuration
Supported protocolsTLSv1.2、TLSv1.3
Negotiated protocolTLSv1.3
Certificate subjectrepolog.io
IssuerGoogle Trust Services
Valid until2026-11-09T11:38 · Remaining when checked: 35 days
Verification detailsCertificate trust: Passed · Hostname match: Passed

HTTP response headers

HeaderValue
content-typetext/html; charset=utf-8
cache-controlpublic, max-age=300, stale-while-revalidate=86400
servercloudflare
strict-transport-securitymax-age=31536000; includeSubDomains; preload
content-security-policydefault-src 'self'; script-src 'self' 'unsafe-inline' https://www.googletagmanager.com https://www.google-analytics.com https://challenges.cloudflare.com; style-src 'self' 'unsafe-inline'; img-src 'self' data: blob: https:; font-src 'self' data:; connect-src 'self' https://www.google-analytics.com https://analytics.google.com https://*.analytics.google.com https://*.google-analytics.com; frame-src https://challenges.cloudflare.com; frame-ancestors 'self'; base-uri 'self'; form-action 'self'; object-src 'none'; upgrade-insecure-requests
x-frame-optionsSAMEORIGIN
x-content-type-optionsnosniff
referrer-policystrict-origin-when-cross-origin
permissions-policycamera=(), microphone=(), geolocation=(), interest-cohort=()

Identified technologies

Cloudflare