

 Paid content
 Visit website
 Updated: 2026-09-27 04:36
 Language: English (default)
 Access: Normal
 Profile views 0
  Outbound visits 0
 Website Review
What is SigNoz?
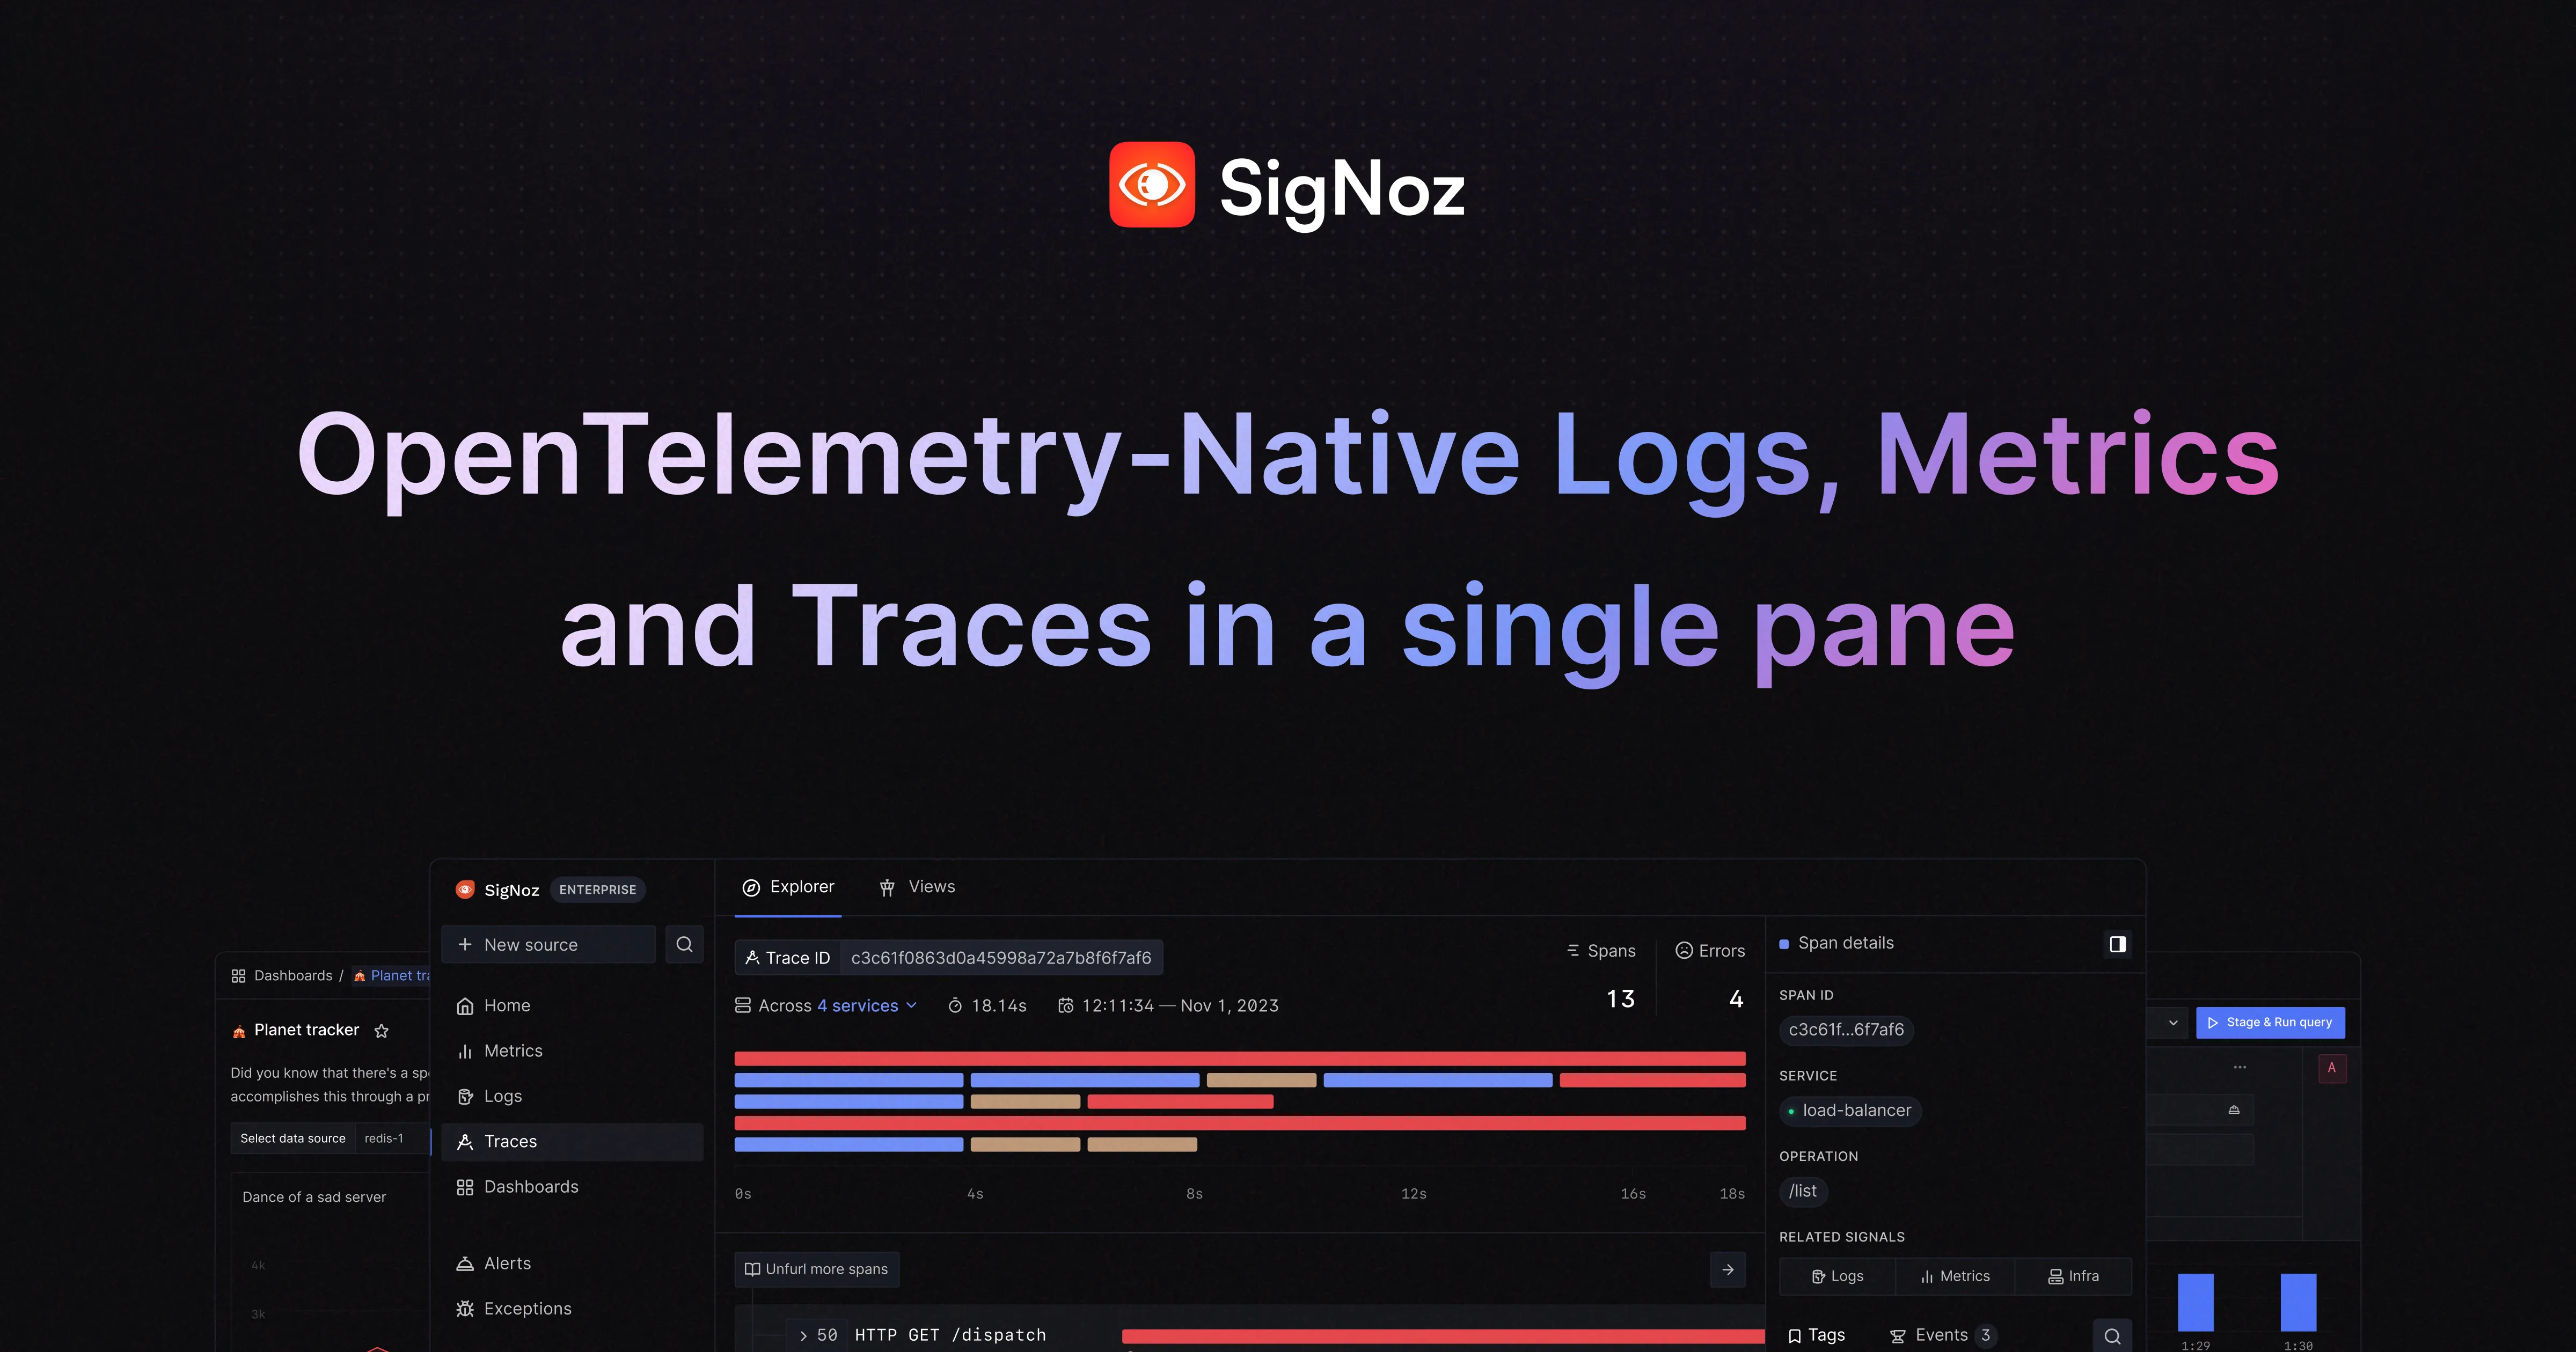
SigNoz is an open-source observability platform built on OpenTelemetry. It collects traces, metrics, and logs in one place so teams can move from a symptom (a slow checkout, a spike in errors) to the underlying evidence (the specific service, database call, or span) without switching between separate tools. The page also positions it as a Datadog alternative, available as SigNoz Cloud or self-hosted on your own infrastructure.
What it covers
- APM: per-service latency percentiles, Apdex, database calls, and external calls.
- Logs: columnar search with trace correlation built in.
- Tracing: trace loading and analysis at scale.
- Alerts: threshold, anomaly, and Apdex alerts across telemetry signals.
- Infrastructure monitoring: Kubernetes, host, and cloud metrics alongside service data.
- Dashboards: reusable templates for services, infra, cloud, databases, and LLM usage.
- LLM observability: telemetry for providers such as OpenAI, Azure OpenAI, Gemini, OpenRouter, and LiteLLM.
- Agent-native features: an MCP server that brings telemetry into coding agents, plus "Noz," an AI assistant inside SigNoz Cloud for investigating incidents, tuning alerts, and building dashboards.
Who it suits and the main trade-off
It fits teams that already use or plan to adopt OpenTelemetry and want one backend rather than several, and organizations that need a self-hosted option for data control. Compliance signals on the page include SOC 2 Type II and HIPAA. The trade-off is typical of open-source observability: self-hosting gives you control but puts storage, scaling, and upgrades on your team, while the cloud option removes that work at the cost of running telemetry through a vendor.
Next step
If you are evaluating it, start with a single high-value service: instrument it with OpenTelemetry, send traces and logs to SigNoz, and check whether you can trace one real incident end to end. Then compare the cloud and self-hosted paths against your data-residency and staffing constraints using the pricing page at SigNoz.
How does SigNoz compare to Datadog for monitoring and observability?
SigNoz is best understood as an OpenTelemetry-native observability platform that competes with Datadog mainly on data ownership, cost model, and flexibility, rather than on breadth of integrations. According to SigNoz, the platform combines APM, logs, traces, metrics, infrastructure monitoring, alerts, dashboards, and LLM/agent telemetry in one tool, with a cloud option and a self-hosted option.
H3 Where they differ in practice
| Dimension | SigNoz | Datadog |
|---|---|---|
| Data collection | Built on OpenTelemetry, an open standard | Primarily proprietary agents, with OTel support |
| Deployment | SigNoz Cloud or self-hosted on your own infrastructure | SaaS only |
| Pricing model | Usage-based, with a pricing calculator published | Usage-based across many separately priced SKUs |
| Scope | One platform for APM, logs, traces, metrics, infra, LLM telemetry | Very broad catalog of products and integrations |
| Ecosystem maturity | Smaller, newer | Large, long-established, extensive third-party integrations |
H3 Who should consider which
- Choose SigNoz if you already instrument with OpenTelemetry, want traces, metrics, and logs correlated in one place without per-host or per-seat surprises, or need to keep telemetry inside your own infrastructure for compliance or cost reasons. The page notes SOC 2 Type II and HIPAA compliance, which matters for regulated teams.
- Choose Datadog if you depend on a very wide set of managed integrations, specialized products (RUM, synthetics, security, CI visibility), or a large partner ecosystem, and you prefer to pay for that breadth.
- A common middle path: standardize on OpenTelemetry for instrumentation so you are not locked in, then evaluate the backend separately. That keeps a future migration realistic.
H3 A concrete evaluation scenario
Suppose your team runs Kubernetes workloads and wants to know why p99 latency spiked. In SigNoz you would look at service-level APM metrics, jump to the correlated traces, then check logs for the same trace ID, and set an alert on the signal — all inside one tool. The trade-off is that you may need to do more of your own setup and accept fewer ready-made integrations than with a mature commercial suite.
Next step: run a two-week pilot with one service. Instrument it with OpenTelemetry, send data to both candidates, and compare three things — time to first useful trace, how quickly you can move from an alert to the responsible span, and your projected monthly bill at realistic volume. Use the SigNoz pricing calculator for the SigNoz side and your own usage assumptions for the other.
Can I self-host SigNoz instead of using SigNoz Cloud?
Yes. SigNoz is available as a self-hosted option, which the site presents as an alternative to SigNoz Cloud. Both are built on OpenTelemetry, so the main decision is where the telemetry lives and who operates the platform.
What stays the same
- Traces, metrics, and logs are collected through OpenTelemetry rather than a proprietary agent.
- The platform covers APM, logs, traces, infrastructure monitoring, alerts, and dashboards.
- LLM and agent telemetry is part of the same product surface, including OpenAI, Azure OpenAI, Gemini, OpenRouter, and LiteLLM sources.
How the two options differ in practice
| Consideration | Self-hosted SigNoz | SigNoz Cloud |
|---|---|---|
| Where data lives | Your infrastructure | Managed by SigNoz |
| Who runs upgrades, storage, scaling | Your team | SigNoz |
| Cost shape | Infrastructure and engineering time | Usage-based pricing |
| Best fit | Strict data residency, existing Kubernetes capacity, teams with platform engineers | Small teams or anyone who wants observability without running storage |
A concrete scenario A platform team already running Kubernetes for its services may prefer self-hosting: telemetry stays inside its network, and it can size storage to its own retention rules. A five-person startup without a dedicated infrastructure engineer will usually get further faster on SigNoz Cloud, then revisit self-hosting only if data-residency rules or volume costs demand it.
Next step Check the official SigNoz documentation for the self-hosted deployment requirements, and compare them against your current infrastructure. If you cannot name who will handle upgrades, disk growth, and query performance, start with the cloud option instead.
How does SigNoz pricing work for high-volume logs and traces?
SigNoz prices on usage, so high-volume logs and traces are the main cost driver. The product page describes "simple usage-based pricing" and "pricing that stays predictable as you scale," with a pricing calculator on the pricing page to estimate a monthly bill. It does not publish per-unit rates on the page described here, so treat the calculator as the source of truth for your numbers rather than assuming a flat fee.
What decides your bill
- Volume ingested or stored for logs and traces is the primary lever. Traces scale with spans, and the page notes trace analysis can load up to a million spans, so span-heavy services (chatty microservices, retries, verbose instrumentation) cost more than the same traffic with sampling.
- Retention matters for logs especially. Columnar log search with trace correlation is only useful over the window you keep, so long retention multiplies volume costs.
- Cardinality and metrics add on top if you also run APM, infra monitoring and dashboards on the same platform.
- Self-hosting versus SigNoz Cloud is the structural choice. The page explicitly offers "the freedom to run on your infrastructure with Self-Hosted SigNoz," which shifts spend from a usage bill to your own compute and storage.
Practical comparison for a high-volume team
| Situation | Likely fit |
|---|---|
| Spiky or unpredictable log/trace volume, small team | SigNoz Cloud with usage-based pricing; model the peak in the calculator first |
| Steady, very high ingest with existing infrastructure | Self-hosted SigNoz, since you control storage and retention costs |
| Already standardized on OpenTelemetry | Either, because the platform is OpenTelemetry-native and avoids re-instrumentation |
Concrete next step
Before committing, take one representative week of telemetry and run it through the calculator at SigNoz. Then apply three reductions and re-estimate: drop debug-level logs at the collector, sample high-volume traces rather than keeping every span, and shorten retention on the noisiest log streams. If the reduced estimate is comfortable, SigNoz Cloud is the simpler path; if ingest is genuinely enormous and steady, self-hosting usually wins on cost but adds operational work. Teams already deep in OpenTelemetry, such as those cited on the page, tend to value avoiding a second agent and a second bill more than squeezing the last dollar out of ingest.
How do I set up OpenTelemetry instrumentation to send data to SigNoz?
Start by choosing how you want to run SigNoz, because that determines the endpoint your instrumentation sends to. SigNoz is built on OpenTelemetry, so you instrument your application with standard OpenTelemetry SDKs or auto-instrumentation and point the exporter at SigNoz rather than at a vendor-specific agent. You can use SigNoz Cloud or self-host SigNoz SigNoz.
The general shape of the setup
- Pick your signal types. Decide whether you need traces only, or traces plus metrics and logs. SigNoz ingests all three and correlates them, so sending traces and logs together usually pays off for troubleshooting.
- Instrument the app. Either add the OpenTelemetry SDK for your language, or use auto-instrumentation (an agent or init container) if you want coverage without code changes.
- Configure the exporter. Set an OTLP exporter with the endpoint and any required authentication header. For SigNoz Cloud this is typically a region-specific OTLP endpoint plus an ingestion key; for self-hosted it is your own collector or SigNoz address.
- Verify. Generate traffic, then confirm spans appear in the traces view and that logs correlate to them.
Concrete example
A Node.js service with auto-instrumentation usually needs only an environment variable pointing at the collector and a startup flag that loads the instrumentation before your app code. A Python service typically installs the OpenTelemetry distro, sets the same OTLP endpoint variables, and runs under the instrumentation wrapper. The exact package names vary by language, so follow the SigNoz docs for your runtime rather than copying another language's setup.
Decision criteria
- Cloud vs. self-hosted: Cloud removes collector operations but requires sending telemetry off your network and managing an ingestion key. Self-hosting keeps data in your infrastructure but you run and scale the collector and storage.
- Auto vs. manual instrumentation: Auto-instrumentation gets you traces quickly across many services; manual instrumentation gives you business-specific spans and attributes that auto-instrumentation cannot infer.
- Collector or direct export: A local OpenTelemetry Collector lets you batch, filter, and redact data before it leaves your environment, which matters for sensitive fields.
Practical next step
Instrument one non-critical service first, confirm end-to-end traces and correlated logs, then roll out to the rest. Check SigNoz's own setup documentation for the current endpoint format and language-specific instructions, and review the pricing page if you are weighing Cloud usage costs SigNoz.
What can I monitor with SigNoz's LLM observability and agent telemetry?
SigNoz's LLM observability is aimed at teams running large language model features and AI agents who want that telemetry sitting alongside their ordinary application monitoring rather than in a separate tool. From the product page, the stated coverage includes OpenAI, Azure OpenAI, Gemini, OpenRouter, LiteLLM, and agent telemetry, with LLM usage appearing in reusable dashboard templates and a SigNoz MCP server that feeds telemetry into coding agents.
What that covers in practice
- Provider-level calls to the supported model services, so you can see how your application's requests to those APIs behave.
- Agent telemetry — the page frames this as "agent-native observability," including an AI teammate (Noz) inside SigNoz Cloud that investigates incidents, tunes alerts, and builds dashboards using the same production context.
- LLM usage dashboards, which the page lists among its reusable templates.
- Correlation with the rest of your stack: because traces, metrics, and logs land in one OpenTelemetry-native platform, an LLM call can be read next to the service, database, and infrastructure signals around it.
A concrete scenario
Suppose a support assistant built on OpenAI starts returning slow, low-quality answers. With this setup you would look at the LLM telemetry for the affected calls, then pivot to the traces and logs of the service wrapping those calls to see whether the delay comes from the model, a database lookup, or a downstream API. That pivot is the main argument for keeping LLM data in the same tool as APM rather than a standalone LLM dashboard.
Trade-offs to weigh
The supported-provider list is specific. If you run models through a gateway or provider not named on the page, check the docs before assuming first-class coverage — generic OpenTelemetry instrumentation may still work, but the curated dashboards and integrations may not apply. Also note the two distinct surfaces: the MCP server serves coding agents, while Noz is an in-product assistant in SigNoz Cloud, so self-hosted users should confirm which of the two they get.
Next step
Open the docs from the page and check the LLM observability and MCP sections against your actual provider and agent framework. If your stack matches the listed providers, the fastest test is to send one real agent workload through and see whether traces, logs, and LLM usage appear correlated in a single view. For the broader platform, see SigNoz; for the underlying standard, OpenTelemetry.
 Hosting and Email
 Cloudflare
 Hosting
 Vercel
 Google Workspace
 Location
 United States
 Pages, Search and Sharing

 All bots


 Registration details

 Identified technologies
User reviews (0)