
 Visit website
 Updated: 2026-10-03 15:56
 Language: English (default)
 Access: Normal
 Profile views 2
  Outbound visits 0
 Website Review
What is Visualize Habit?
Visualize Habit is a free web tool for turning small daily habits into a year-long picture of what they add up to. Instead of tracking streaks day by day, it projects the compounding result of a habit you commit to, so you can see outcomes like books read, calories burned, words learned or steps walked over 12 months. The site frames this around a familiar problem: 80% of New Year's resolutions fail, often because the goal is vague or unrealistic. Its answer is to pick a tiny habit, set a realistic frequency, and let the calculator show the scale of the payoff.
How it works in practice
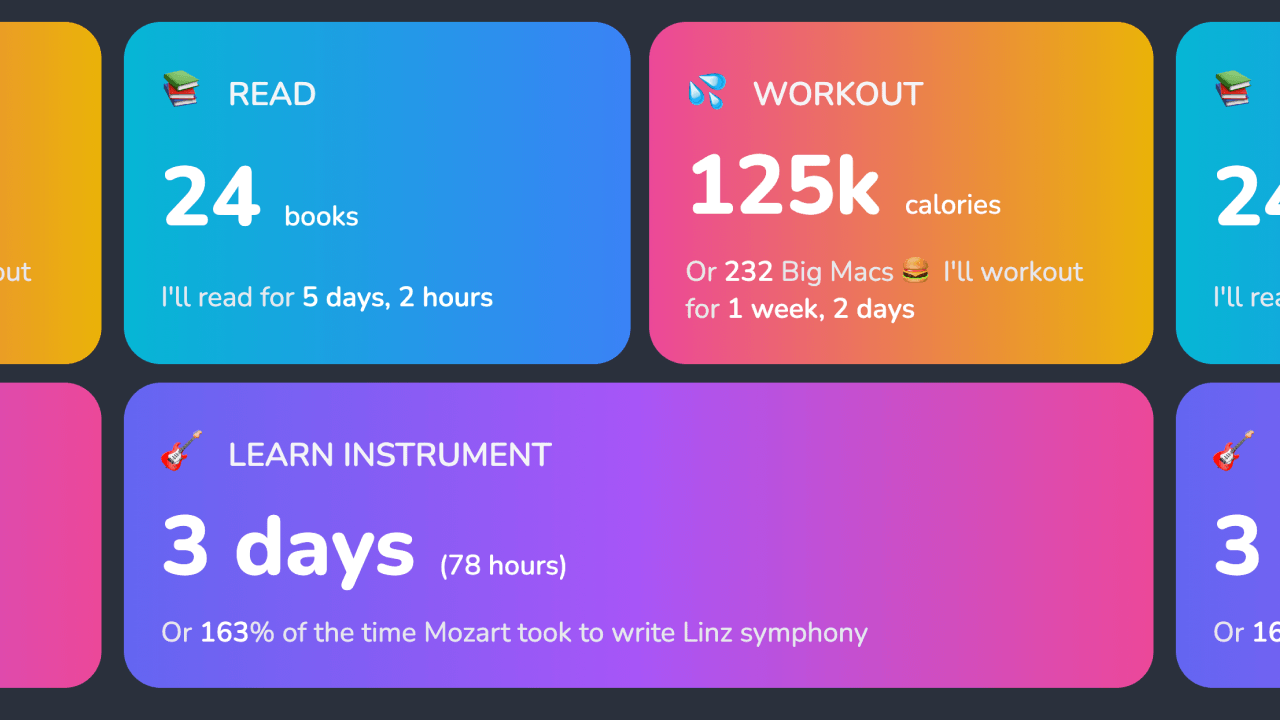
The page presents a habits grid plus a calculator. You choose or shuffle suggested habits, set how often you'll do them, and it estimates the cumulative result. Examples from the page include reading 15 minutes a day, which it projects as 18 books in a year; working out, shown as calories burned and compared to Big Macs; learning a language, shown as new words and progress toward everyday conversation; walking, expressed in steps and distance; and learning an instrument, expressed as total hours. The comparisons are deliberately vivid rather than clinical, and one visitor, Patrice, is quoted saying it motivates you to start a tiny habit.
Who it suits
- People who respond to seeing the end result rather than a checklist.
- Anyone restarting after failed resolutions who wants a smaller, more realistic starting point.
- Learners juggling several habits who want one place to see how they stack up.
Trade-offs to know
It is a visualization and motivation tool, not a full habit tracker with reminders, history or accountability features. The projections are estimates based on your chosen frequency, so they assume consistency you haven't yet demonstrated. If you need daily logging and streak data, a dedicated tracker may fit better; if you need a reason to begin, the compounding view is the point.
Next step
Pick one habit you could genuinely do for a few minutes a day, enter your realistic frequency, and look at the one-year number. If it feels motivating rather than intimidating, start there instead of adding five habits at once.
How does the Visualize Habit calculator estimate what I'll achieve in a year?
It turns a small daily habit into a yearly total by multiplying your habit's daily amount by the number of days you plan to do it, then converting that total into a relatable real-world comparison.
On the page, the example is reading 15 minutes a day, 7 days a week, which is presented as producing "18 books" in a year. Other examples translate the same kind of yearly accumulation into calories burned, new words learned, steps walked or kilometres covered, and hours of instrument practice. The point is not precision for its own sake: the calculator is designed to make compounding visible so a tiny habit feels worth starting.
What the estimate depends on
- Your daily quantity (minutes, pages, steps, calories, words)
- How many days per week you intend to do it
- Whether the tool assumes you keep that pace all year
- The conversion factor it uses to turn raw totals into books, Big Macs, Eiffel Towers or conversation milestones
How to read the result
Treat the yearly number as a motivational projection, not a forecast. It assumes perfect consistency, and 80% of New Year's resolutions fail, as the page itself notes. A realistic version is to discount the total for missed days: if you expect to hit your habit five days a week rather than seven, your true annual figure is roughly 70% of the displayed one.
A practical next step
Pick one habit, enter a daily amount you could do on your worst day, then look at the yearly comparison. If the number still feels motivating after you mentally subtract a few missed weeks, it is a reasonable habit to start. If it only looks impressive at an unrealistic daily amount, lower the daily target until the projection survives real life.
Which tiny habits does Visualize Habit suggest for New Year's resolutions?
Visualize Habit suggests a short starter list of daily habits and then shows what each one compounds into over a year. From the page evidence, the featured examples are:
- Reading — 15 minutes a day, 7 days a week, framed as roughly 18 books in a year.
- Working out — tracked as calories burned, with the example of about 62.4k calories, or "116 Big Macs," and about 4 days and 8 hours of total exercise time.
- Learning a language — about 2.81k new words, described as 94% of what's needed for everyday conversation.
- Walking — about 364k steps, or 277 km, compared with 838 Eiffel Towers.
- Learning an instrument — about 52 hours, or 108% of the time Mozart reportedly took to write the Linz symphony.
The site also presents a shuffle option and a habits grid, so the list is meant as inspiration rather than a fixed plan: you pick a tiny daily action, see the yearly total, and adjust until the number feels motivating.
A practical way to choose: pick the habit whose daily version feels almost too easy (15 minutes of reading, a short walk), then check whether the yearly number is one you actually care about. If the yearly payoff doesn't excite you, swap the habit rather than raising the daily target.
Can Visualize Habit show how my habits compound over 10 years?
Yes. Visualize Habit is built around exactly that idea: it takes a small daily habit and projects how it accumulates over time, and the page explicitly offers a view of how habits compound over one year or ten years. The examples on the page show the pattern — reading 15 minutes a day becomes 18 books in a year, a daily workout becomes tens of thousands of calories, language practice becomes roughly 2,800 new words.
What the compounding view is good for
- Making small inputs feel real. Ten years of a 15-minute habit sounds trivial until it is totalled up. The projection does the arithmetic so the habit stops feeling negligible.
- Choosing between candidate habits. If you are deciding whether to commit to walking, reading or language practice, seeing the ten-year totals side by side makes the trade-off concrete.
- Getting past the motivation dip. The page frames this as beating procrastination and as an antidote to resolutions that fail — the long-run number is the argument for starting today rather than next month.
Where it is weaker
A ten-year projection is a motivational illustration, not a forecast. It assumes perfect consistency: every day, no illness, no holidays, no lost interest. Real adherence curves bend. Use the ten-year figure to decide whether the habit is worth starting, then track actual streaks for a realistic picture — the site also offers a habits grid for that.
A practical next step
Pick two habits you are genuinely torn between, enter both, and compare the one-year totals first. If a habit's one-year number does not excite you, the ten-year number will not save it; if it does, the ten-year view is a useful reminder to keep going on the days you skip. For habit-building method rather than arithmetic, James Clear covers the underlying principles, and Habitica turns daily tracking into a game if streaks alone do not hold your attention.
How does Visualize Habit help me beat procrastination?
Visualize Habit tackles procrastination by making the payoff of small daily actions concrete before you start. The page positions this around a blunt statistic—"80% of New Year's resolutions fail"—and offers a way to avoid that outcome: pick tiny habits, then see what they add up to over a year.
How it works in practice
- Choose from suggested habits. The site proposes starter habits such as reading, working out, learning a language, walking, or learning an instrument, so you don't stall on deciding what to do.
- Set a small daily amount. The example is reading 15 minutes a day, 7 days a week—deliberately easy enough that skipping feels more effortful than doing it.
- See the compounded result. The calculator translates that input into a year-scale outcome: 18 books, 62.4k calories burned, 2.81k new words, 364k steps, or 52 hours of instrument practice.
- Use a habits grid. A visual grid tracks consistency over the year, which turns "did I do it today?" into a visible record rather than a vague intention.
The anti-procrastination mechanism is the gap between effort and reward. Fifteen minutes feels trivial in the moment, but the projected yearly total makes the trivial feel worth starting. That reframing addresses the classic procrastination trap: tasks feel too large to begin, so you delay. Shrinking the task and enlarging the visible reward attacks both halves of that trap.
A reader scenario
Suppose you want to learn a language but keep putting it off because fluency feels years away. Instead of "learn Spanish," you commit to a few minutes of vocabulary daily. The calculator shows roughly 2.81k words in a year—about 94% of what the site says is needed for everyday conversation. That single number can be more motivating than an abstract goal, because it makes a year of small sessions look like a finish line rather than an endless slog.
Trade-offs to weigh
- Motivation vs. maintenance. Seeing a big yearly number can get you started, but the grid only helps if you keep logging. The tool is strongest at the beginning, when inertia is highest.
- Projection vs. reality. Yearly totals assume near-perfect consistency. Real life includes sick days and travel, so treat the figures as an upper bound, not a promise.
- Suggested habits vs. your priorities. The built-in list covers common goals; if your actual priority isn't there, the compounding math still works, but you'll need to define the habit yourself.
- Free calculator vs. deeper tracking. A simple calculator and grid suit people who want a light nudge. If you need reminders, streaks across many habits, or detailed analytics, a dedicated tracker may fit better.
How to decide if it's for you
Use it if your problem is starting—if you know what you want to do but keep postponing it. Pick one tiny habit, run the calculator once, and let the yearly figure be your reason to begin today. If your problem is sustaining many habits over months, compare it with a fuller tracker such as Habitica or a simple paper grid, and choose based on how much structure you'll actually maintain.
Is Visualize Habit free to use?
Yes, Visualize Habit is free to use. The site presents its habit calculator as a free tool: you pick small daily habits, and it projects the cumulative result over a year (and up to ten years) to show how consistency compounds. There are no pricing links or payment platforms listed on the page, so nothing on the site suggests a paid tier or trial.
What "free" gets you
- A habit picker with suggested options such as reading, working out, walking, learning a language or an instrument.
- A calculator that converts a small daily action into a yearly total — for example, reading a set number of minutes per day becomes a count of books finished.
- A habit grid view for the year, plus a shuffle option to swap in different habits.
- Motivational framing rather than tracking features: the emphasis is on visualizing outcomes to beat procrastination, not on logging each completed day.
Where it may not be enough
This is a projection and motivation tool, not a full habit tracker. If you want streaks, reminders, daily check-offs or history across multiple years, a dedicated tracker will serve you better. Habitica gamifies daily tasks and habits, while Streaks is built around completing a fixed set of daily actions on Apple devices. For the underlying method, the ideas in Atomic Habits pair naturally with this kind of compounding math.
A practical next step
Treat the calculator as a one-session exercise: choose two or three habits you could genuinely do on your worst day, note the yearly figure it produces, then move that commitment into whatever tracker you already open daily. The number is the motivation; the tracker is what keeps it honest.
 Hosting and Email
 Namecheap
 Hosting
 Vercel
 Location
 Walnut, California, United States
 Pages, Search and Sharing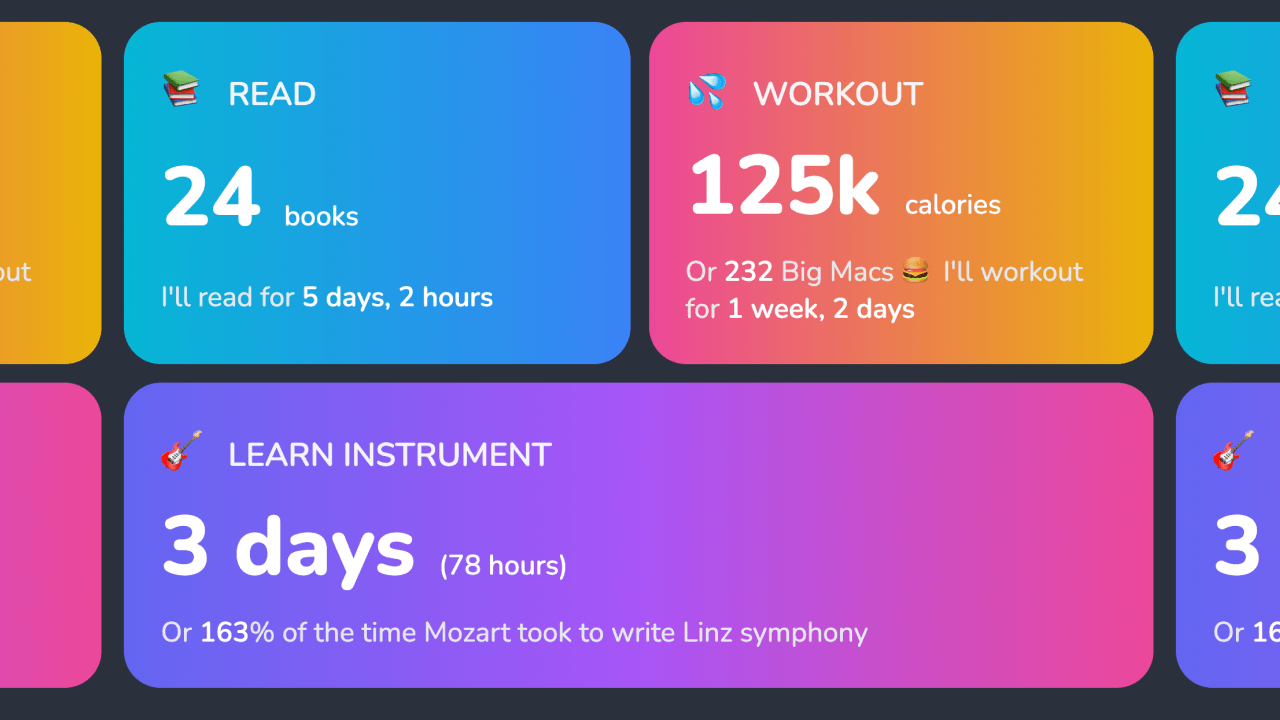


 All bots
 Registration details

 Identified technologies
User reviews (0)