
 cachethq.io
No paid content found
cachethq.io
No paid content found
Categories: Development
From startups to Fortune 500 companies, organizations worldwide trust Cachet to streamline their downtime communication, enhancing transparency with customers and stakeholders.
 Visit website
 Updated: 2026-09-29 11:56
 Language: English (default)
 Access: Normal
 Profile views 4
 Outbound visits 2
Related questions
More questions →What Are Open-Source UI Element Libraries and How Do They Differ From UI Frameworks?
An open-source UI element library is a collection of individual, ready-made interface pieces—buttons, cards, inputs, toggles, loaders—that you copy into your own project and adapt. A UI framework, by contrast, is a structured system of components, conventions, and often a theming layer that governs how your whole interface is built. The practical difference: an element library gives you a snippet; a framework gives you a way of working. If you need a polished button in ten minutes, reach for the element library. If you're building a 40-screen product with a team, you probably want the framework.
What "open-source UI element library" actually means
The term gets used loosely, so it helps to separate the parts:
- Open-source: the code is publicly available, and the license tells you what you may do with it—copy, modify, redistribute, or use commercially.
- UI element: a single, self-contained piece of interface, usually small enough to read in one sitting. A button with hover states, a pricing card, a search field.
- Library: a browsable, searchable collection of those elements, typically contributed by many different people.
On a site like Uiverse, elements are shared by a community and written in plain CSS or Tailwind. You find one you like, copy the markup and styles, paste them into your project, and adjust colors, spacing, and text to fit. There's no package to install and no build step required—which is exactly the appeal, and also the source of most of the confusion.
Element library vs. UI framework: the core differences
| Dimension | Open-source UI element library | UI framework / design system |
|---|---|---|
| Unit of reuse | A single snippet you copy | A component you import or call |
| Installation | None; paste into your code | Package install, config, sometimes a provider |
| Consistency | Depends on you; each element may look different | Enforced by shared tokens and APIs |
| Theming | Manual edits per element | Central theme/config file |
| Updates | You own the copy; no upstream updates | Version bumps bring fixes and changes |
| Accessibility | Varies per contributor; must be checked | Usually tested and documented |
| Best for | Prototypes, landing pages, small sites, one-off needs | Multi-page apps, teams, long-lived products |
| Learning curve | Low—read the CSS | Higher—learn the API and conventions |
The table isn't a verdict. It's a map of trade-offs. Element libraries win on speed and freedom; frameworks win on consistency and maintenance.
Licensing and attribution: what to check before you paste
This is where people get into trouble, and it's worth slowing down for.
- Find the license. Every element or collection should state one. Common open-source licenses include MIT, Apache-2.0, and BSD. Some projects use copyleft licenses like GPL, which can impose obligations if you redistribute your code.
- Understand what the license permits. MIT and Apache-2.0 are permissive: you can typically use the code in commercial and closed-source projects. Copyleft licenses may require you to release derivative source under the same terms.
- Check attribution requirements. Permissive licenses usually require you to keep the copyright notice and license text somewhere in your project. That's a real obligation, not a formality.
- Look for per-element terms. On community sites, the site's overall terms and the individual contributor's stated wishes may differ. If a contributor asks for credit, honor it.
- When in doubt, ask or avoid. If a snippet has no license at all, you don't have clear permission to reuse it. Treat "no license" as "not open source," even if the code is publicly visible.
This article is general information, not legal advice. For commercial products with real exposure, have someone qualified review the licenses you're relying on.
How to use a community element in your project: a practical workflow
Here's a repeatable process that avoids most of the usual mess.
1. Start from a real need, not a browsing session
Decide what you need first—"a compact primary button with a loading state"—then search. Browsing aimlessly produces a pile of pretty snippets that don't fit together.
2. Copy the smallest version that works
Take the markup and the styles. Strip anything you don't need: demo wrappers, extra animations, decorative layers. Less code means fewer surprises.
3. Convert it to your conventions
If your project uses design tokens or CSS variables, replace hard-coded values:
/* Before: hard-coded */
.button { background: #4f46e5; border-radius: 8px; }

/* After: token-based */
.button { background: var(--color-primary); border-radius: var(--radius-md); }
This one step is what keeps a copied element from looking like a foreign object in your UI.
4. Check accessibility before you ship
Community elements vary widely here. Verify at minimum:
- Keyboard focus is visible and the element is reachable by Tab.
- Color contrast meets WCAG AA (4.5:1 for normal text).
- Interactive elements use semantic HTML (
<button>, not a clickable<div>). - Form inputs have associated labels.
- Motion respects
prefers-reduced-motion.
5. Test in context
Paste it into a real page with real content. Long labels, small screens, and dark mode break more copied elements than anything else.
6. Note where it came from
Keep a short comment or an internal credits file: source, license, date. Future you—and your legal reviewer—will be grateful.
Where element libraries genuinely shine
- Prototypes and demos: you need something clickable today, not a design system.
- Landing pages and marketing sites: a handful of distinctive elements, each custom.
- Filling gaps: your framework lacks one specific component, and you don't want to build it from scratch.
- Learning: reading well-made CSS is one of the fastest ways to improve.
- Small projects: a personal site doesn't need a theming architecture.
Where they fall short
- Consistency at scale: ten elements from ten contributors rarely look like one product.
- Maintenance: you own every copy. When your design changes, you edit each one.
- Accessibility debt: you inherit whatever the contributor did or didn't do.
- No upstream fixes: a bug fixed in the original won't reach your copy.
- Integration friction: different naming conventions, different units, different assumptions about resets.
When to choose which
Choose an element library when the scope is small, the timeline is short, or you need a few distinctive pieces rather than a whole system.
Choose a framework or design system when multiple people build multiple screens over months, when consistency is a product requirement, or when accessibility and theming need to be guaranteed rather than checked.
A hybrid works well for many teams: adopt a framework for the structural components—forms, navigation, layout—and borrow individual elements for the places where you want personality. Just route every borrowed element through the same token and accessibility checks, so it lands as part of your system rather than beside it.
The short version: open-source UI element libraries are a fast, flexible way to get good-looking interface pieces into a project. They are not a substitute for a design system, and the license and accessibility details are the part worth reading carefully.
What Is Monitoring and How Do You Set It Up for Websites and Services?
Monitoring is the practice of automatically checking a website or service on a schedule to confirm it is reachable and behaving as expected, then alerting someone when it is not. You need it whenever downtime or degraded performance has a real cost — lost signups, failed payments, or support tickets you hear about before your own dashboards do. A basic setup requires three things: something to check (an endpoint, port, or DNS record), a condition that defines "healthy," and a destination for alerts.
Monitoring vs. uptime vs. status pages
These three terms get used interchangeably, but they describe different layers of the same job:
| Concept | What it is | Who consumes it |
|---|---|---|
| Monitoring | The automated checks running in the background | You and your on-call team |
| Uptime | The measured result — the percentage of time a service was available | Stakeholders, reports, SLAs |
| Status page | The public or internal page showing current and past service state | Customers, internal teams |
Monitoring produces the data. Uptime is a summary of that data over time. A status page is a presentation layer on top of both. You can monitor without ever publishing a status page, and you can publish a status page that is updated manually — but automated monitoring is what makes the page trustworthy.
What monitoring actually checks
A check is a request plus an expected response. The most common types:
- HTTP/HTTPS endpoints — request a URL and verify the status code, response body, or response time. This is the default for web apps and APIs.
- DNS records — confirm a domain resolves to the expected address, catching expired records or misconfigured nameservers before users hit them.
- TCP ports — open a raw connection to a port to verify a database, mail server, or other non-HTTP service is listening.
- Custom conditions — evaluate the response against rules you define, such as "body contains
"status":"ok"" or "response time under 500 ms."
The condition matters as much as the check. A 200 response with an error message in the body is still a failure from a user's perspective, which is why body and latency conditions exist.
How automated monitoring works
The loop is simple and repeats on an interval you choose:
- Schedule — a timer triggers the check, typically every 30 seconds to 5 minutes depending on how fast you need to know.
- Request — the monitor sends the HTTP request, DNS query, or TCP connection.
- Evaluate — the response is compared against your conditions (status code, body content, latency threshold).
- Record — the result is stored, building the history that uptime percentages are calculated from.
- Alert — if the condition fails, a notification fires to email, Slack, PagerDuty, or a webhook.
Most tools add a confirmation step: a single failed check may not trigger an alert, but two or three consecutive failures will. This avoids waking someone up over a transient network blip.
Setting up basic monitoring
The exact steps depend on your tool, but the sequence is consistent:
- Pick what to monitor. Start with your most critical user-facing URL — the homepage or a health endpoint — plus one dependency like your database port or DNS record.
- Define the healthy condition. For a web app, that usually means HTTP 200 and a response body containing an expected string. For an API, check a specific field in the JSON.
- Set the interval. Shorter intervals detect problems faster but generate more traffic and noise. One minute is a reasonable starting point for most sites.
- Configure alerting. Choose a channel your team actually watches. Include the check name, the failure reason, and a link to the monitor in the alert message.
- Add a confirmation threshold. Require two or three consecutive failures before alerting to filter out false positives.
- Verify it works. Temporarily point the check at a URL you know will fail, confirm the alert arrives, then restore it.
If you are using an open-source tool like Gatus, the configuration is typically a YAML file where each endpoint gets a name, URL, interval, conditions, and alert destinations. The same structure applies whether you self-host or use a hosted service.
Common failures and how to troubleshoot them
False positives from transient errors. A single timeout during a deploy or a brief network hiccup can fire an alert. Fix: require consecutive failures before notifying.
Monitoring the wrong thing. A check that only confirms the server responds with 200 will miss a broken database connection that returns 200 with an error page. Fix: add body-content conditions, not just status codes.
Alert fatigue. If every minor latency spike pages someone, the team stops reading alerts. Fix: separate critical alerts (service down) from warnings (slow response) and route them to different channels.
Checks failing from the monitor's location but not for users. A firewall or geo-blocking rule may reject your monitor's IP. Fix: run checks from multiple regions, or whitelist the monitor's addresses.
No baseline, so you cannot tell if something is wrong. Without historical data, a 2-second response time looks fine until you realize it used to be 200 ms. Fix: let monitoring run long enough to establish normal ranges before setting latency thresholds.
The goal is not to monitor everything — it is to monitor what breaks in ways that matter, with conditions specific enough to catch real problems and thresholds loose enough to avoid crying wolf.
What Is Uptime and Why Does It Matter for Websites?
Uptime is the percentage of time a website or service is operational and reachable by users. It matters because every minute of downtime can mean lost visitors, failed transactions, and damaged trust. This explainer covers how uptime is calculated, what causes downtime, how monitoring works, and how to track and improve uptime for your own site.
What uptime actually measures
Uptime is usually expressed as a percentage over a given period (often a month or a year). It answers a simple question: for what share of the time was the service available and responding correctly?
A service that is "up" is not just powered on — it is reachable over the network and returning the expected response. If a server is running but the web page times out, most monitoring tools count that as downtime.
How uptime is calculated
The basic formula is:
uptime % = (total time - downtime) / total time × 100
The difference between "three nines" and "four nines" is larger than it looks. Here is the allowed downtime per common uptime target:
| Uptime target | Downtime per day | Downtime per month (30 days) | Downtime per year |
|---|---|---|---|
| 99% | ~14.4 min | ~7.2 hours | ~3.65 days |
| 99.9% | ~1.44 min | ~43.2 min | ~8.76 hours |
| 99.99% | ~8.6 sec | ~4.32 min | ~52.6 min |
| 99.999% | ~0.86 sec | ~26 sec | ~5.26 min |
This is why 99.9% and 99.99% are treated as very different commitments: the gap is roughly a factor of ten in allowed downtime.
Common causes of downtime
Downtime rarely has a single cause. Typical sources include:
- Outages — hardware failure, power loss, or a cloud provider incident.
- Maintenance — planned upgrades, patches, or migrations that take the service offline.
- Network issues — DNS failures, routing problems, or connectivity loss between users and the server.
- Application errors — crashes, bad deployments, or database problems that make the site unreachable or return errors.
- Traffic overload — a spike that exceeds capacity and slows or blocks responses.
Planned maintenance is sometimes excluded from uptime calculations, but only if it is announced and agreed with users. Unplanned downtime is what most uptime metrics focus on.
How uptime monitoring works
An uptime monitor checks your site or service at regular intervals from one or more locations. Each check sends a request and records whether the response arrived and matched expectations.
What monitors can check:
- HTTP/HTTPS availability — whether the page loads and returns a success status.
- Keyword monitoring — whether a specific word or phrase appears in the response, catching cases where the page loads but shows an error message.
- SSL certificate monitoring — whether the certificate is valid and not close to expiry.
- Cron and heartbeat monitoring — whether scheduled jobs run on time.
When a check fails, the monitor can send an alert by email, SMS, Slack, or other channels. Alerts signal that a check failed — they do not by themselves explain why. The value is in fast notification so you can investigate before users report the problem.
UptimeRobot, for example, offers these monitoring types and states you can start monitoring in 30 seconds, with notifications via email, SMS, Slack, and more. Its published description also mentions 50 monitors available for free. Check the current pricing page for the latest plan details, since limits and features can change.
Practical steps to track and improve uptime
- Set a target. Decide what uptime level your users actually need. An internal tool may be fine at 99%, while a payment page may need 99.99%.
- Monitor from outside. Use an external monitor so you detect problems even when your own network is fine.
- Check more than the homepage. Monitor key pages, APIs, and login flows — the parts users depend on.
- Add keyword checks. A page can return HTTP 200 while showing "Service unavailable." Keyword monitoring catches that.
- Watch SSL expiry. An expired certificate makes the site unreachable for many users even if the server is healthy.
- Route alerts to the right place. Send alerts to a channel someone actually watches, and define who responds.
- Review incidents. After downtime, note the cause and whether monitoring caught it early. Adjust checks and thresholds accordingly.
- Reduce single points of failure. Redundancy, backups, and capacity planning lower the chance and length of outages.
Why uptime matters
Uptime is a direct proxy for reliability. For a business site, downtime can mean lost sales and support load. For a service, it can mean broken integrations and churn. Tracking uptime turns reliability from a vague feeling into a number you can set targets against, alert on, and improve over time.
What Is a Status Page and What Should It Include?
A status page is a public or private web page that shows the current health of your services and the history of incidents affecting them. Teams use one to answer "is it down, and when will it be fixed?" without fielding every question individually. It differs from a marketing site (which sells) and an internal dashboard (which is for operators): a status page is written for the people affected by downtime—customers, partners, or internal stakeholders.
Core components of a useful status page
| Component | What it does | Why it matters |
|---|---|---|
| Service list | Names the systems you monitor (API, dashboard, payments) | Lets readers find their specific dependency |
| Current status | Shows operational / degraded / partial outage / major outage | Gives an at-a-glance answer |
| Incident history | Logs past incidents with timestamps and updates | Builds trust and reduces repeat questions |
| Subscriber notifications | Pushes updates by email, SMS, Slack, or webhook | Reaches people who aren't refreshing the page |
| Scheduled maintenance | Announces planned work in advance | Separates expected downtime from failures |
Instatus, for example, groups these into three jobs on its homepage: monitor your services, fix incidents with your team, and publish to your status page. That framing is a good checklist for any tool you evaluate.
How a status page fits into incident response
A status page is not a standalone product—it's the outward-facing end of an incident workflow.
- Detect — Monitoring checks availability and performance and fires real-time alerts across channels.
- Notify internally — Alerts route to the right people so responders aren't guessing who owns the issue.
- Collaborate — Teams work the incident in tools they already use; Instatus highlights integrations and Slack/Teams collaboration as part of this step.
- Publish — You post an incident update to the status page, which notifies subscribers.
- Review — After resolution, the incident history becomes the raw material for a post-incident review.
The practical benefit: customers get one canonical source instead of scattered tweets and support tickets, and your team stops writing the same update five times.
Setup choices you'll actually have to make
- Public vs. private — A public page is for customers; a private page is for internal teams or a limited set of partners. Instatus describes pages as something you can "make it yours, make it private, or share to the world."
- Custom domain and branding — Hosting the page on your own domain (for example,
status.yourcompany.com) keeps it recognizable and separates it from your main site. - Component granularity — Too few components and updates are vague; too many and the page becomes noise. Group by what customers actually depend on.
- Notification channels — Offer at least email plus one real-time channel (Slack, SMS, webhook) so subscribers choose their own signal-to-noise level.
- Severity labels — Define what "degraded performance" versus "partial outage" means before you need them, so updates are consistent under pressure.
Common pitfalls
- Stale updates. An incident that stays "investigating" for hours is worse than no page. Set a cadence (for example, every 30 minutes) and stick to it.
- Unclear severity labels. If your team can't agree on what counts as a major outage, readers can't either.
- No subscribe option. A status page nobody follows only helps people who already know to look.
- Marketing copy in incident updates. Keep updates factual: what's affected, what you know, what you're doing, when the next update comes.
- Forgetting maintenance windows. Planned work announced in advance prevents a routine deploy from looking like an outage.
Getting started
Instatus advertises a free-forever plan at $0/month, a setup that "takes 30 seconds," and no card required, with paid tiers available via its pricing page. If you want to evaluate it or any alternative, test these in order: connect one service to monitoring, publish one test incident, subscribe yourself to notifications, and confirm the update reaches you. That sequence tells you more about fit than any feature list.
Website Overview
An established domain and managed infrastructure suggest continuity of operations and may support dependable delivery, although neither guarantees service quality.
Domain and Registration
Registered in 2014, this domain has about 11 years of history. That suggests continuity, although ownership and purpose may have changed. Transfer-protection status is present, helping reduce the risk of unauthorized domain transfers. The registrar is GoDaddy.com, LLC, a widely used domain service provider. The domain uses the common .io extension, which is not an independent safety signal.
DNS and Email
Nameservers are provided by Cloudflare, indicating managed DNS hosting. MX records point to the Fastmail email service. No CNAME was found; the observed records resolve directly to addresses. SPF and DMARC are configured. DKIM status is unknown. TXT records include verification markers for Google. Such markers may also remain after a service stops being used.
TLS and Certificates
The public key uses EC with 256 bits. The server supplied a complete certificate chain. No organization name is present in the certificate; the available fields are consistent with domain validation. The certificate was issued within the Google Trust Services cloud or CDN ecosystem. The certificate's total validity is about 90 days, consistent with a short renewal cycle.
HTTP and Browser Security
The response lacks these common security headers: HSTS, CSP, Referrer-Policy, Permissions-Policy. No X-Powered-By header was found, reducing one common source of backend fingerprinting information. The cf-ray response header indicates a CDN or caching proxy in the delivery path. No obvious internal addresses or debug information were found in the headers. The Server header identifies cloudflare without an exact version.
Technology Stack Analysis
The public page identifies Cloudflare without precise versions, leaving fewer clues for version-specific scanning.
Search and Social Sharing
The meta description has 176 characters and may be shortened in search results. Twitter Card metadata is configured. The title has 51 characters, within a common display range. The observed directives allow indexing and link following. No Generator meta tag is publicly exposed.
 Hosting and Email
 Cloudflare
 Hosting
 Fastmail
 Location
 unknown
104.21.25.150
Location
Location unknown
104.21.25.150
 Pages, Search and Sharing
| Meta description | From startups to Fortune 500 companies, organizations worldwide trust Cachet to streamline their downtime communication, enhancing transparency with customers and stakeholders. |
|---|---|
| Canonical URL | https://cachethq.io |
| Language | English (default) |
| Twitter Card | summary_large_image |
Social Sharing Preview
15 fields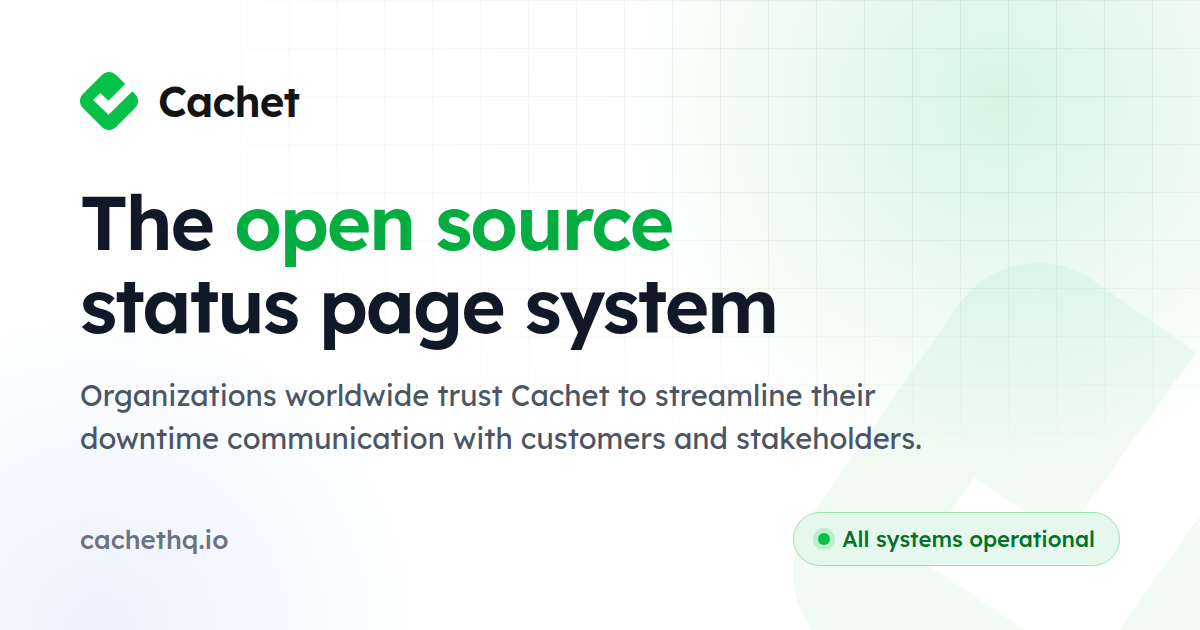

Sharing metadata
| og:url | https://cachethq.io |
|---|---|
| og:type | website |
| og:image | https://cachethq.io/images/og/home.png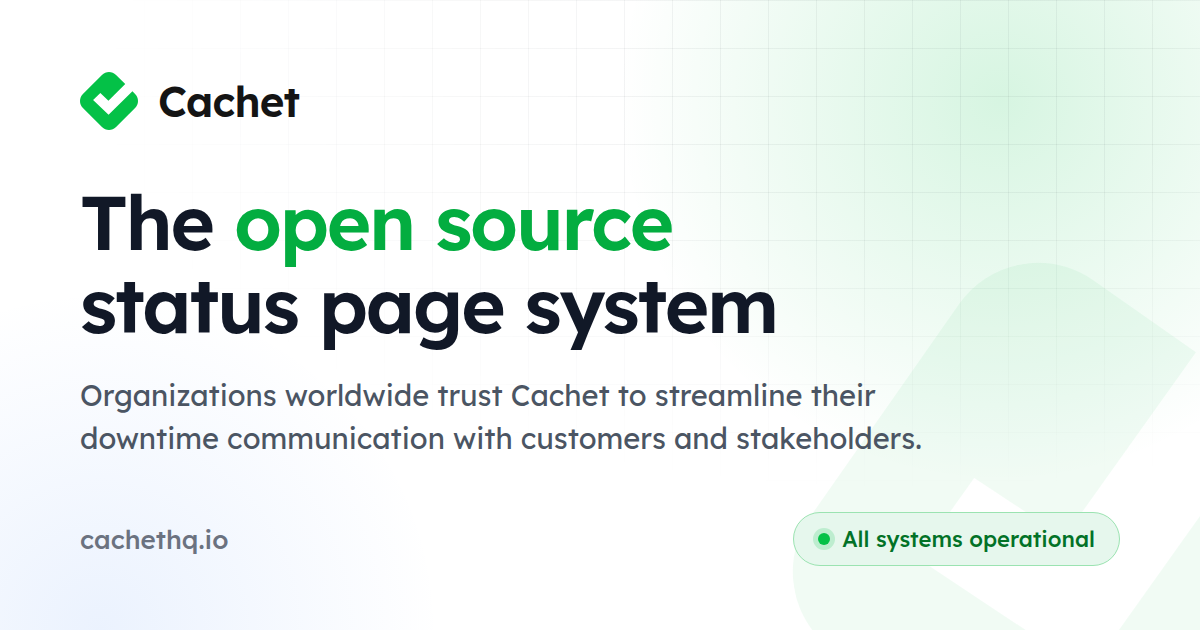 |
| og:title | Cachet, the open source status page system |
| og:site_name | Cachet |
| og:description | From startups to Fortune 500 companies, organizations worldwide trust Cachet to streamline their downtime communication, enhancing transparency with customers and stakeholders. |
| og:image:width | 1200 |
| og:image:height | 630 |
| twitter:url | https://cachethq.io |
| twitter:card | summary_large_image |
| twitter:site | @cachethq |
| twitter:image | https://cachethq.io/images/og/home.png |
| twitter:title | Cachet, the open source status page system |
| twitter:creator | @jbrooksuk |
| twitter:description | From startups to Fortune 500 companies, organizations worldwide trust Cachet to streamline their downtime communication, enhancing transparency with customers and stakeholders. |
robots.txt (opens in a new tab)
0 rulesAll bots 0 allowed · 0 disallowed

 All bots
No matching rules.
Sitemaps
0No sitemaps found
 Registration details RDAP / WHOIS
| Registrar | GoDaddy.com, LLC |
|---|---|
| Registered | 2014-12-29 |
| Expires | 2026-12-29 |
| Domain status | clientDeleteProhibited https://icann.org/epp#clientDeleteProhibited、clientRenewProhibited https://icann.org/epp#clientRenewProhibited、clientTransferProhibited https://icann.org/epp#clientTransferProhibited、clientUpdateProhibited https://icann.org/epp#clientUpdateProhibited |
| Nameservers | kehlani.ns.cloudflare.com、kenneth.ns.cloudflare.com |
| DNSSEC | unsigned |
 DNS records
| Type | Name | Value | TTL | Priority |
|---|---|---|---|---|
| A | cachethq.io | 104.21.25.150 | 300 | — |
| A | cachethq.io | 172.67.134.84 | 300 | — |
| AAAA | cachethq.io | 2606:4700:3031::6815:1996 | 300 | — |
| AAAA | cachethq.io | 2606:4700:3032::ac43:8654 | 300 | — |
| MX | cachethq.io | in1-smtp.messagingengine.com | 300 | 10 |
| MX | cachethq.io | in2-smtp.messagingengine.com | 300 | 20 |
| NS | cachethq.io | kehlani.ns.cloudflare.com | 86400 | — |
| NS | cachethq.io | kenneth.ns.cloudflare.com | 86400 | — |
| TXT | cachethq.io | google-site-verification=wtKw3zu5iOn8K1f7AthfXJj0UCqiEKJC7uUQgp8Nc0o | 3600 | — |
| TXT | cachethq.io | v=spf1 include:helpscoutemail.com include:_spf.google.com include:spf.messagingengine.com ~all | 3600 | — |
| DMARC | _dmarc.cachethq.io | v=DMARC1; p=none; pct=100; rua=mailto:[email protected]; | 300 | — |
 TLS and certificates
| Assessment | Normal configuration |
|---|---|
| Supported protocols | TLSv1.2、TLSv1.3 |
| Negotiated protocol | TLSv1.3 |
| Certificate subject | cachethq.io |
| Issuer | Google Trust Services |
| Valid until | 2026-12-09T10:59 · Remaining when checked: 70 days |
| Verification details | Certificate trust: Passed · Hostname match: Passed |
 HTTP response headers
| Header | Value |
|---|---|
| content-type | text/html; charset=utf-8 |
| cache-control | no-cache, private |
| server | cloudflare |
| x-frame-options | deny |
| x-content-type-options | nosniff |
| set-cookie | Redacted |
 Identified technologies
User reviews (0)