
 concepts.app
 Paid content
Categories: Design & Creativity
Every idea begins as a concept. Write notes on the infinite canvas, make mind-maps and mood boards, sketch plans, designs and illustrations. Share with friends, clients and other apps.
 Visit website
 Updated: 2026-09-26 20:55
 Language: English (default)
 Access: Normal
 Profile views 2
 Outbound visits 0
Related questions
More questions →How Do You Draw Vector Graphics in Inkscape?
Inkscape is a professional vector graphics editor for Linux, macOS, and Windows that stores drawings as SVG (Scalable Vector Graphics). You draw by creating and editing objects defined by paths, shapes, and mathematical coordinates rather than pixels, so your artwork can be resized without losing quality. This guide covers the core workflow: setting up a document, drawing with shapes and the pen tool, editing nodes, managing fills, strokes, and layers, and exporting your work.
Vector vs. raster drawing
A raster image (like a photo or a PNG) is a grid of colored pixels. Enlarging it too far reveals those pixels as blur or blocky edges. A vector drawing describes shapes mathematically — a circle is stored as a center point and a radius, not as a pattern of dots — so it stays sharp at any size.
That difference shapes how you work in Inkscape:
- Objects, not paint. You place and transform discrete objects (rectangles, paths, text) instead of brushing pixels.
- Editable at any time. You can return to a shape later and change its size, color, or curve.
- Resolution-independent output. The same file can produce a small icon or a large poster.
Vector graphics suit logos, icons, diagrams, illustrations, posters, and anything that needs clean edges or repeated resizing. Raster graphics remain the better choice for photographs and painterly textures.
Setting up a new document
- Open Inkscape and choose File > New (or start from a template if one fits your output).
- Open File > Document Properties to set the page size and orientation. Match this to your intended output — for example, A4 for a printable poster or a square canvas for an icon.
- Decide on units (px, mm, in) in the same dialog so your measurements stay consistent.
- Save early with File > Save As and keep the
.svgformat. SVG is Inkscape's native format and preserves all editable objects.
A useful habit: set the document size before drawing, because changing it later can shift how your composition sits on the page.
Core drawing tools
Inkscape gives you two broad approaches — draw a predefined shape, or draw a path point by point.
Shapes
The shape tools create objects you can still adjust parametrically:
- Rectangle — drag to draw; use the tool controls to set exact width, height, and corner rounding.
- Ellipse/Circle — drag for an ellipse, or hold Ctrl to constrain to a circle.
- Star/Polygon — set the number of points or sides and the spoke ratio.
- 3D Box — build simple perspective boxes.
Because these stay parametric, you can select a rectangle later and change its corner radius without redrawing it.
Pen and Bezier
The Pen (Bezier) tool draws paths directly:
- Click to place straight-line corner nodes.
- Click and drag to pull out curve handles, creating smooth curves.
- Press Enter to finish an open path, or close it by clicking the first node.
This is the tool for custom outlines — a logo mark, a map boundary, a hand-drawn silhouette.
Pencil (freehand)
The Pencil tool draws freehand paths. You can smooth the result afterward, which makes it useful for quick sketching that you then clean up.
Editing nodes and paths
Once a path exists, the Node tool is where precision happens. Select a path and you can:
- Move nodes to reshape the outline.
- Add or delete nodes to control how much detail a curve carries.
- Convert between corner and smooth nodes to switch between sharp angles and flowing curves.
- Adjust handles to change a curve's direction and tension.
A practical rule: use as few nodes as the shape allows. Fewer, well-placed nodes produce cleaner curves and smaller files than many nodes nudged into place.
You can also combine and modify paths with operations like Path > Union, Difference, and Combine, which merge or subtract shapes to build complex forms from simple ones.
Fills, strokes, and layers
Every object has a fill (its interior) and a stroke (its outline). The Fill and Stroke panel controls both:
- Fill: flat color, gradient, or pattern; plus opacity.
- Stroke: color, width, and style such as dashes and caps.
- The Ctrl+Shift+F shortcut opens this panel directly.
Layers (via the Layer menu) let you separate parts of a drawing — background, main artwork, annotations — and lock or hide each independently. This keeps complex drawings manageable and lets you work on one element without accidentally selecting others.
Exporting your drawing
Inkscape's native save format is SVG, which keeps everything editable. When you need a different format:
- File > Save As and choose SVG to keep the working file.
- File > Export (or Export As) to produce a PNG at a chosen pixel size or DPI, or to export a selected area only.
For print or further editing elsewhere, keep the SVG as your master and export PNG copies as needed. Exporting a PNG at a higher DPI gives you a larger raster version, but the SVG remains the source of truth.
Common sticking points
- "My lines look jagged." You may be zoomed in on a raster preview; vector paths stay smooth. Check the actual path, not the screen rendering.
- "I can't select what I want." Another object or layer may be on top or locked. Check the layer panel and object order.
- "The file got huge." Excessive nodes or embedded raster images inflate SVG size. Simplify paths and link rather than embed large images where possible.
- "Nothing is editable." If you imported a raster image, it stays a bitmap inside the document — you can move and scale it, but not edit its pixels as vectors.
Where to go next
Start with one small project — an icon or a simple diagram — and use only shapes plus the node tool. Once that feels natural, add the pen tool for custom curves and gradients for depth. The Inkscape project publishes documentation and tutorials on inkscape.org, and the software runs on Linux, macOS, and Windows desktops.
What Is Sozi and How Does It Create Animated SVG Presentations?
Sozi is a presentation tool that animates an SVG document rather than laying out slides on a canvas. You draw your content in a vector editor such as Inkscape, define a sequence of viewport frames over that drawing, and Sozi pans and zooms between them to produce the presentation. It suits non-linear, map-like, or diagram-based talks where you want to move around one large visual instead of advancing through discrete slides.
How Sozi's model differs from a slide editor
In a conventional slide tool, each slide is a separate page and transitions move you forward or backward. Sozi inverts that: the SVG document is the whole world, and each "slide" is a saved camera position on it.
- The document is the stage. Everything lives in one SVG file, so a diagram, map, or illustration can be arbitrarily large.
- A slide is a viewport frame. You place a frame around the region you want the audience to see; Sozi animates the camera from one frame to the next.
- Motion is spatial, not sequential. Because frames are just positions, you can jump between distant regions, revisit a detail, or build a route through the drawing.
This is why Sozi is often described as adding pan-and-zoom animation to SVG rather than as a slide editor.
The SVG workflow
The practical loop is: create the artwork, then define the presentation over it.
- Draw in a vector editor. Inkscape is the natural companion because it edits SVG natively and Sozi's frames are stored inside the SVG document itself.
- Add viewport frames. Each frame marks a region of the drawing that becomes one step of the presentation.
- Order and present. Sozi plays the frames as an animated sequence, moving and scaling the view between them.
Because the presentation data lives in the SVG, the file stays portable and editable with standard vector tools.
Where Sozi fits
Sozi is a good match when your content is inherently spatial:
- A large diagram you want to explore piece by piece
- A map or floor plan where you zoom into locations
- An illustrated process where the camera follows a path
- A non-linear talk where you return to an overview between points
If your content is mostly text and bullet lists, a conventional slide tool will usually be faster.
Getting started
The project publishes release announcements on its site, and a Sozi Guide has been written to teach the tool. Start from the current release and the guide, then experiment with a small SVG to see how frames map to presentation steps.
- Check the latest release announcement for the current version.
- Follow the Sozi Guide for a structured introduction.
- Build a test SVG with two or three frames to understand the camera behavior before committing a full deck.
What Are Vector Graphics and When Should You Use Them?
Vector graphics are images built from mathematical paths—points, lines, curves, and shapes defined by coordinates—rather than a grid of colored pixels. That single difference determines almost everything else: vector files scale to any size without blurring, stay editable as discrete objects, and usually remain small for simple artwork. Use vector graphics for logos, icons, illustrations, diagrams, and print-ready designs where clean edges and resizing matter. Use raster images instead for photographs and highly detailed, pixel-level textures.
How vector graphics actually work
A vector image is a set of instructions. Each shape is a path made of anchor points (nodes) connected by straight segments or curves, with attributes like fill color, stroke width, and opacity attached to it. The software recalculates and redraws those instructions at whatever size you request.
A practical example: a circle is stored as "center at this coordinate, this radius, this fill." Zoom to 10,000% or print it on a billboard, and the renderer simply draws a bigger, equally smooth circle. A raster circle is stored as a grid of pixels approximating a circle, so enlarging it means stretching those pixels into visible blocks.
Because objects stay separate, you can select one shape, move it, recolor it, or reshape a single node without touching the rest. That object-level editability is the core reason vector tools exist.
Vector vs. raster: the trade-offs
| Dimension | Vector | Raster |
|---|---|---|
| Structure | Math-based paths, nodes, shapes | Grid of pixels |
| Scaling | Resolution-independent; sharp at any size | Loses quality when enlarged beyond native resolution |
| File size | Small for simple shapes; grows with complexity | Grows with pixel dimensions and detail |
| Editability | Objects, nodes, and attributes remain editable | Edits affect pixels; reshaping is destructive or approximate |
| Best for | Logos, icons, illustrations, type, diagrams, print layouts | Photos, scans, painted textures, detailed imagery |
| Weakness | Poor fit for photographic detail; node editing has a learning curve | Poor fit for clean edges and repeated resizing |
Neither format wins universally. Many real projects combine them—for instance, a poster with a vector logo and headline over a raster photograph.
Common vector file formats and what they are good for
- SVG (Scalable Vector Graphics) — an open, XML-based format. Ideal for web graphics, icons, and UI assets because it is text-based, styleable, and animatable. It is the native working format in Inkscape.
- PDF — a page-description format that can contain vector paths, text, and raster images. Common for print-ready documents and sharing layouts that must look identical across systems.
- EPS — a legacy but still widely accepted format for print and professional design handoff. Often used when a printer or client specifically requests it.
If you are unsure, SVG is the most flexible choice for screen work, and PDF is the safest for print delivery.
Typical use cases
- Logos and brand marks — must stay crisp from a favicon to a building sign.
- Icons and UI elements — small, clean, and easy to recolor or restyle.
- Illustrations and diagrams — flat or stylized artwork with defined shapes and lines.
- Posters and print-ready designs — text and shapes that need to scale to a specific physical size.
- Cutting, engraving, and plotting — machines that follow paths rather than read pixels.
Practical limits to know before you start
- Not for detailed photos. Converting a photograph to vector (tracing) produces many paths and rarely matches the original's subtlety. Raster remains the right tool for photographic content.
- Complexity has a cost. Thousands of nodes make files heavy and slow to edit, even though the format is resolution-independent.
- Node editing has a learning curve. Understanding anchors, handles, and path operations takes practice; simple shape and text work is much quicker to pick up.
- Conversion is not lossless. Moving between vector and raster formats usually loses either editability or detail.
Where Inkscape fits
Inkscape is professional vector graphics software that runs on Linux, macOS, and Windows desktop computers, and it works natively with SVG. That makes it a reasonable choice if you want to create or edit vector graphics—logos, icons, illustrations, posters—without committing to a proprietary format, and if you value an open, XML-based document you can inspect and hand off. If your work is mainly photographic retouching, a raster editor will serve you better; if it is path-based design, Inkscape covers the core workflow.
What Does Design Mean in Stainless Steel Fabrication?
In stainless steel fabrication, design means engineering the part so it can actually be made: setting dimensions, material grade, joint and weld details, finish and tolerances, then checking that the workshop can cut, form, weld and finish it as drawn. It is not graphic design or product styling. This stage matters whenever you need a bespoke stainless item — a frame, tank, duct, pipework run or enclosure — and it usually starts from your sketch, sample or drawing rather than a finished CAD model.
What the design stage covers
Design work in a fabrication shop turns an idea into instructions the workshop can follow. That normally includes:
- Geometry and dimensions — overall sizes, bend radii, hole positions, and how parts fit together.
- Material grade — which stainless grade suits the environment (for example a grade chosen for corrosion resistance or for weldability). The fabricator should confirm the grade rather than assume it.
- Joint and weld details — where seams run, whether welds are visible or dressed, and how access is provided for the welder.
- Finish — the surface treatment required, such as a brushed, polished or other finish, and which faces are cosmetic.
- Tolerances — how accurate the finished part must be, since tighter tolerances generally mean more work.
How design decisions affect manufacture and cost
Most cost and lead-time differences between two apparently similar parts come from design choices, not from the amount of steel:
| Design choice | Effect on fabrication |
|---|---|
| Complex geometry with many bends | More forming steps, more chances of distortion |
| Welds in hard-to-reach positions | Slower welding, higher risk of defects |
| Visible, dressed welds | Extra finishing time |
| Tight tolerances | More checking and rework |
| Cosmetic finish on all faces | More handling and protection during work |
A design that is easy to weld and finish is usually cheaper and faster than one that only looks simple on paper.
Typical design-to-manufacture workflow
- Brief or sketch — you provide a drawing, sketch, photo or sample, plus what the part must do.
- Design review — the fabricator checks feasibility, suggests changes, and confirms grade, finish and tolerances.
- Agreed drawing — a dimensioned drawing or model is signed off before cutting starts.
- Fabrication — cutting, forming, welding and finishing to the agreed drawing.
- Inspection — the finished part is checked against the drawing and finish specification.
The design review step is where most problems are caught cheaply, before any material is cut.
Common design mistakes that cause delays
- Missing dimensions, or dimensions that do not add up.
- No material grade specified, or a grade that is hard to weld or form.
- Finish left undefined, so the workshop guesses.
- No tolerance stated, leading to disagreement at inspection.
- No allowance for weld distortion on large or thin panels.
- Cosmetic faces not marked, so they get scratched during handling.
Questions to ask a fabricator at the design stage
- Which grade do you recommend for this environment, and why?
- Can this be made as drawn, or would a small change reduce cost or lead time?
- Which faces are cosmetic, and how will you protect them?
- What tolerance can you hold, and how will it be checked?
- Will welds be visible, dressed or hidden?
- What do you need from me before you can quote and start?
Getting clear answers to these before fabrication begins is the practical way to avoid rework and unexpected cost.
What Is Product Design and What Does It Actually Involve?
Product design is the end-to-end process of deciding what a digital product should do, how it should work, and how it should look and feel — then shipping it and improving it based on real use. It runs from early research and strategy through wireframes, prototypes, usability testing, and design handoff, and it continues after launch through iteration. It's the right lens when you're building or reshaping an actual product (an app, a platform, a service experience) rather than producing a one-off asset like a logo or a campaign. If your problem is "we need a thing that works and that people can use," that's product design. If it's "we need to be recognized and understood," that's closer to branding.
How product design differs from UX, UI, and branding
These terms overlap in practice, but they answer different questions. The distinctions matter most when you're scoping a project or hiring.
| Discipline | Core question | Typical output |
|---|---|---|
| Product design | What should we build, and does it work end to end? | Strategy, flows, prototypes, shipped interface, iteration plan |
| UX design | Can people accomplish their goal without friction? | Research findings, user flows, wireframes, usability test results |
| UI design | Is the interface clear, consistent, and usable at the surface? | Screens, components, states, visual specs |
| Branding / brand identity | What does this stand for, and how is it recognized? | Positioning, logo, identity system, guidelines |
Product design is the broadest of the four: it usually contains UX and UI work, and it needs to stay consistent with branding. A product designer may do all of this on a small team, or specialize on a large one. The practical test is scope — if the work includes deciding what to build and owning the result after launch, it's product design, not just UX or UI execution.
What the work actually involves, stage by stage
A typical engagement moves through these stages. They aren't strictly linear — research often reopens after testing — but each stage has a concrete purpose and output.
1. Discovery and framing
Understand the business goal, the users, and the constraints. Inputs: stakeholder interviews, existing analytics, support tickets, competitive review. Output: a clear problem statement and success criteria you can measure later.
2. Research
Talk to users, observe behavior, and review data. The goal isn't a report — it's decisions. Output: user needs, jobs-to-be-done, and prioritized problems worth solving.
3. Strategy and structure
Decide what to build first and how it fits together. Output: information architecture, user flows, and a rough scope. This is where a product designer earns their keep — choosing what not to build.
4. Wireframes and prototypes
Move from structure to testable form. Low-fidelity wireframes test layout and logic cheaply; interactive prototypes test whether people can complete a task. Output: wireframes, clickable prototypes, and the questions each is meant to answer.
5. Usability testing
Put prototypes in front of real users and watch what breaks. Output: usability findings ranked by severity, plus specific fixes. Testing five users surfaces most major issues; you don't need a large sample to learn a lot.
6. Visual design and design systems
Apply the brand and build reusable components. A design system — tokens, components, states, and usage rules — is what keeps a product consistent as it grows. Output: high-fidelity screens and a documented component library.
7. Handoff and build support
Give engineers what they need: specs, states (empty, loading, error, edge cases), assets, and access to the design file. Handoff is a conversation, not a file drop — expect questions and adjust in review.
8. Iteration after launch
Ship, measure against the success criteria from discovery, and improve. Output: prioritized changes based on real behavior, not opinion.
Common deliverables
- Problem statement and success metrics
- User research findings and personas or jobs-to-be-done
- User flows and information architecture
- Wireframes and interactive prototypes
- Usability test findings with severity ratings
- High-fidelity screens and a design system
- Developer specs covering states and edge cases
- Post-launch iteration recommendations
How product designers work with everyone else
Product design sits between business, engineering, and the user, so most of the job is coordination.
- With product managers: align on priorities, scope, and what "done" means. The PM owns the why and when; the designer owns the what and how it works.
- With engineers: agree early on feasibility and constraints. Involving engineers during wireframing prevents expensive rework later.
- With marketers and brand: keep the product consistent with how the company presents itself. A strong identity that the product ignores creates a credibility gap.
The site's own framing supports this: Kevin Woo Designs describes combining "strategic expertise with hands-on support" and delivering "measurable results across every touchpoint," with services spanning product strategy, UI/UX design, design systems, and growth. That's the product-design range — strategy through shipped interface — rather than a single narrow craft.
Signs a product design effort is going wrong
Watch for these, and course-correct early:
- Design starts before the problem is defined. If no one can state the user problem and how you'll measure success, you're decorating, not designing.
- Prototypes never meet real users. Untested assumptions are the most common source of rework.
- No design system. Inconsistency creeps in, and every new screen costs more than the last.
- Handoff is a file drop. If engineers can't ask questions, edge cases get guessed and quality drops.
- Launch is treated as the finish line. Without a measurement and iteration plan, you can't tell whether the design worked.
A concrete example
Take a redesign of a daily-use tool for a chronic condition, like the insulin pump work described on the site. The product-design version of that job isn't "make the screen prettier." It's: research how people actually manage treatment day to day, define what the tool must teach versus what it must do, structure the flow so it fits into a real routine, prototype and test it with users, design the interface and its states, hand it to engineers with edge cases covered, then measure whether people use it correctly and iterate. That's the full arc — and it's why product design is a process, not a deliverable.
If you're scoping this work, start by writing down the problem and how you'll know it's solved. Everything else follows from getting that right.
Website Overview
Identifiable technologies and additional version or configuration signals make the service easier to fingerprint, which may help targeted scanners narrow their checks. An established domain and managed infrastructure suggest continuity of operations and may support dependable delivery, although neither guarantees service quality.
Domain and Registration
Registered in 2018, this domain has about 8 years of history. That suggests continuity, although ownership and purpose may have changed. Transfer-protection status is present, helping reduce the risk of unauthorized domain transfers. The registrar is Squarespace Domains II LLC., a widely used domain service provider. The domain uses the common .app extension, which is not an independent safety signal.
DNS and Email
The lowest TTL is 5 seconds, supporting rapid record changes at the cost of more frequent lookups. Nameservers are provided by Google Cloud DNS, indicating managed DNS hosting. MX records point to the Google Workspace email service. No CNAME was found; the observed records resolve directly to addresses. SPF and DMARC are configured. DKIM status is unknown.
TLS and Certificates
The certificate issuer is Sectigo Limited, a commercial certificate authority. The certificate uses an RSA 2048-bit public key, offering broad client compatibility. The server supplied a complete certificate chain. No organization name is present in the certificate; the available fields are consistent with domain validation. The certificate is valid for about 198 days in total, with 118 days remaining.
HTTP and Browser Security
The Server header exposes the software version: nginx/1.30.4. This makes version-targeted checks easier, but is not proof of an exploitable vulnerability. The response lacks these common security headers: CSP, Permissions-Policy. No X-Powered-By header was found, reducing one common source of backend fingerprinting information. The via response header indicates a CDN or caching proxy in the delivery path. No obvious internal addresses or debug information were found in the headers.
Technology Stack Analysis
The public page identifies nginx 1.30.4, with exact versions exposed for 1 technologies. These details can narrow vulnerability checks, although exposure alone is not a vulnerability.
Search and Social Sharing
The meta description has 184 characters and may be shortened in search results. No homepage canonical URL was detected. If duplicate URLs exist, consolidation may be less explicit. The title has 43 characters, within a common display range. The observed directives allow indexing and link following. No Generator meta tag is publicly exposed.
 Hosting and Email
 Google Cloud DNS
 Hosting
 Google LLC
 Location
 Kansas City, Missouri, United States
 Pages, Search and Sharing
| Meta description | Every idea begins as a concept. Write notes on the infinite canvas, make mind-maps and mood boards, sketch plans, designs and illustrations. Share with friends, clients and other apps. |
|---|---|
| Canonical URL | Not detected |
| Language | English (default) |
| Twitter Card | Not detected |
Social Sharing Preview
8 fields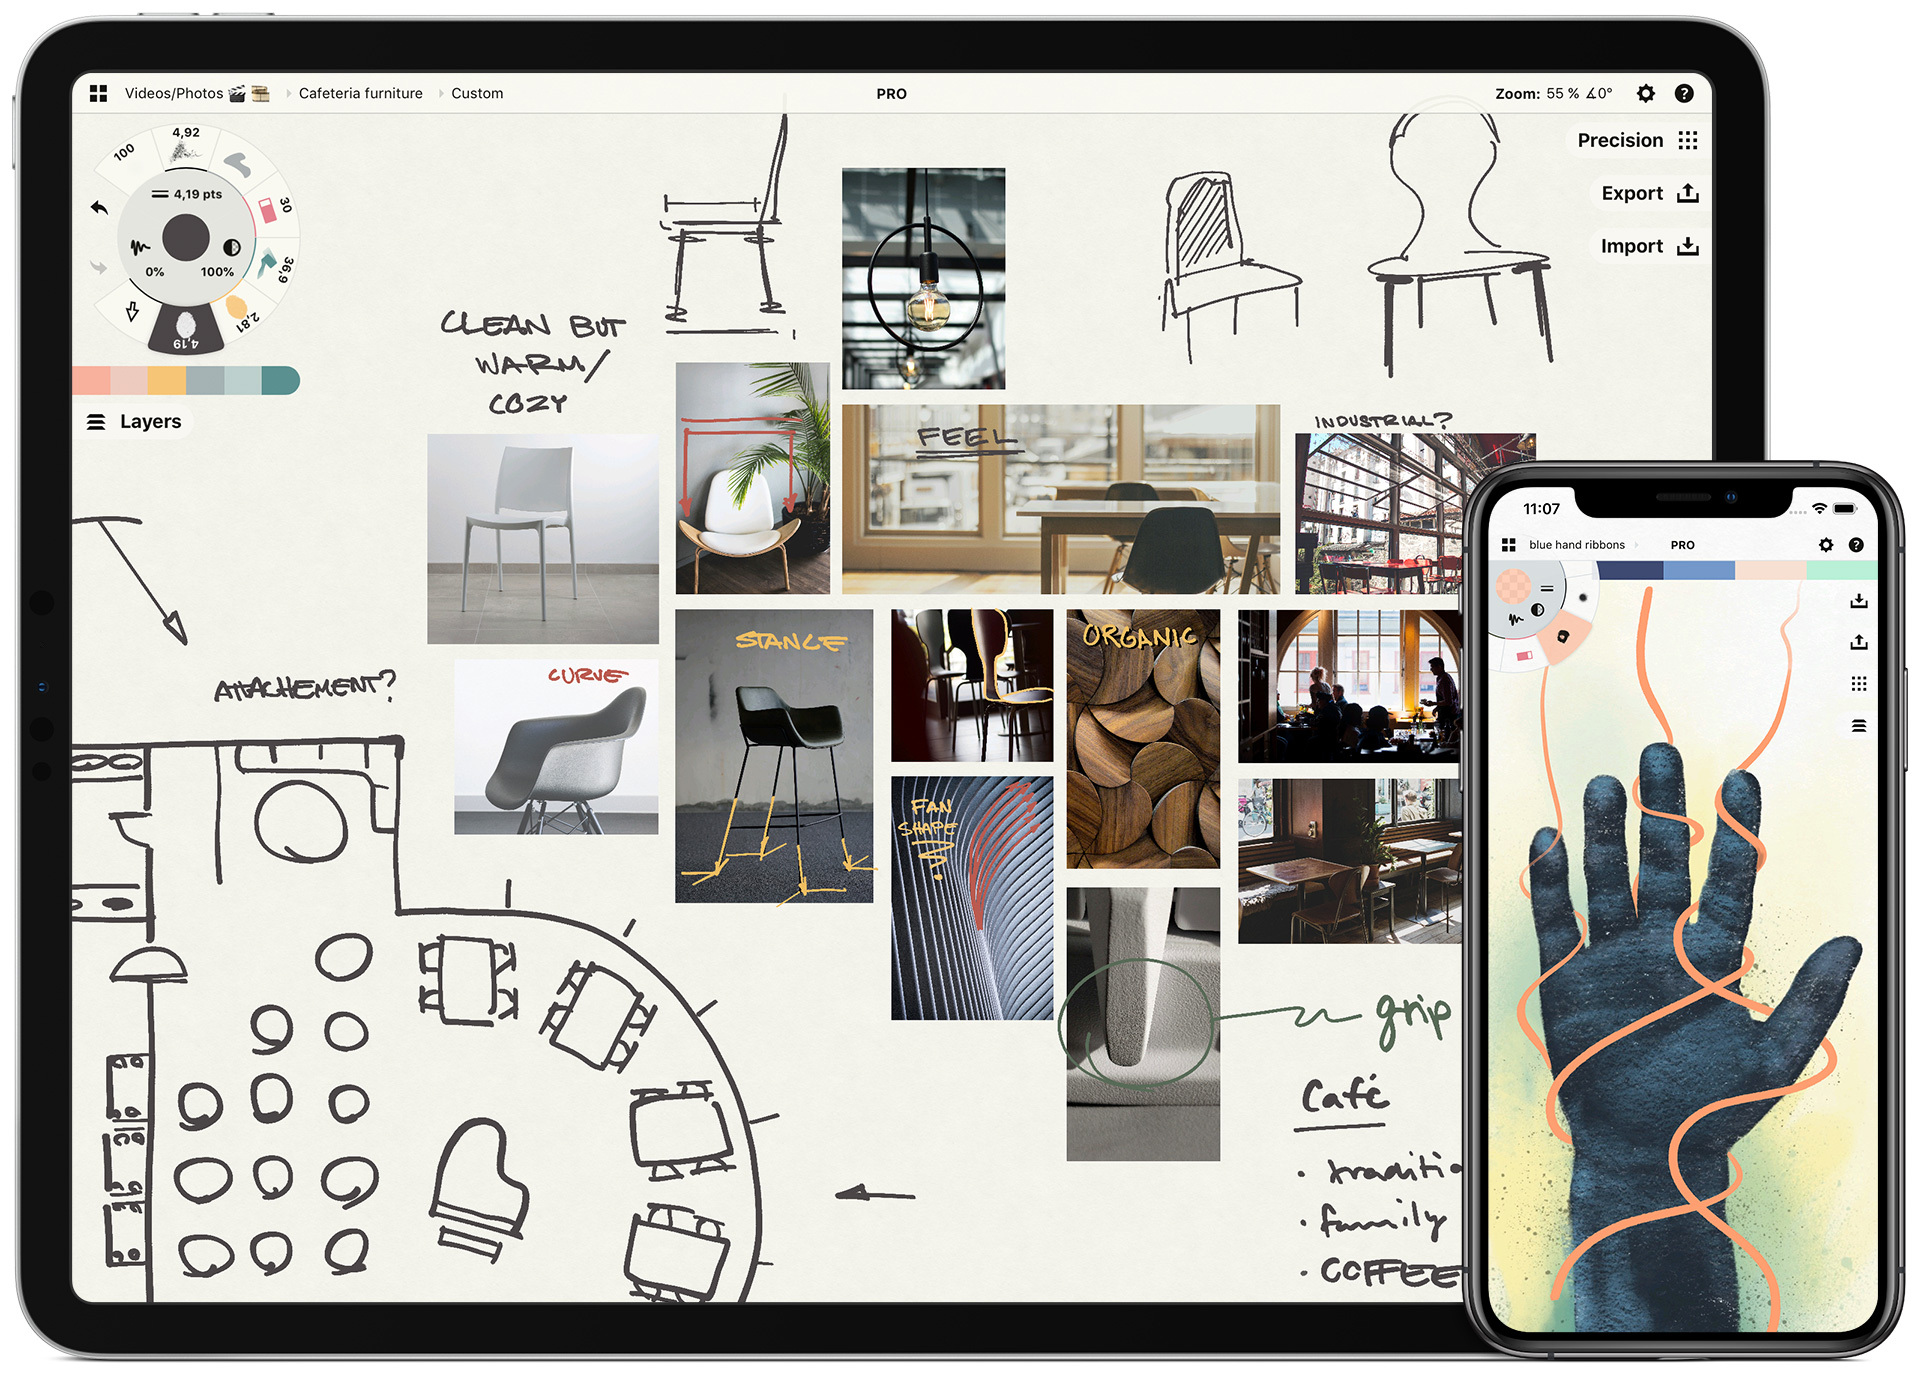
Sharing metadata
| og:url | https://concepts.app/en/ |
|---|---|
| og:type | product |
| og:image | https://cdn.tophatch.com/img/social/concepts_moodboard.jpg |
| og:title | Concepts App • Infinite, Flexible Sketching |
| og:site_name | ConceptsApp |
| og:description | Every idea begins as a concept. Write notes on the infinite canvas, make mind-maps and mood boards, sketch plans, designs and illustrations. Share with friends, clients and other apps. |
| og:image:width | 1280 |
| og:image:height | 853 |
robots.txt (opens in a new tab)
13 rulesohdear 1 allowed · 0 disallowed

 ohdear

/
All bots 0 allowed · 12 disallowed

/admin//s/*/*/site/admin/*/admin/*/fetch/*/t/*/en/concepts-quick-start-tutorial*/*/account/*/*/account/*/search/*/search/*/*/samsung-concepts-partnership*
No matching rules.
Sitemaps
1 Registration details RDAP / WHOIS
| Registrar | Squarespace Domains II LLC. |
|---|---|
| Registered | 2018-05-08 |
| Expires | 2027-05-08 |
| Domain status | client delete prohibited、client transfer prohibited |
| Nameservers | ns-cloud-d1.googledomains.com、ns-cloud-d2.googledomains.com、ns-cloud-d3.googledomains.com、ns-cloud-d4.googledomains.com |
| DNSSEC | unsigned |
 DNS records
| Type | Name | Value | TTL | Priority |
|---|---|---|---|---|
| A | concepts.app | 34.160.197.107 | 300 | — |
| AAAA | concepts.app | 2600:1901:0:c39f:: | 300 | — |
| MX | concepts.app | aspmx.l.google.com | 300 | 1 |
| MX | concepts.app | alt1.aspmx.l.google.com | 300 | 5 |
| MX | concepts.app | alt2.aspmx.l.google.com | 300 | 5 |
| MX | concepts.app | alt3.aspmx.l.google.com | 300 | 10 |
| MX | concepts.app | alt4.aspmx.l.google.com | 300 | 10 |
| NS | concepts.app | ns-cloud-d1.googledomains.com | 21600 | — |
| NS | concepts.app | ns-cloud-d2.googledomains.com | 21600 | — |
| NS | concepts.app | ns-cloud-d3.googledomains.com | 21600 | — |
| NS | concepts.app | ns-cloud-d4.googledomains.com | 21600 | — |
| TXT | concepts.app | google-site-verification=XhiIkcr6KJT6kchqGGpfyuJrOsfCTY5_JhUB9Lvf8ls | 5 | — |
| TXT | concepts.app | google-site-verification=ij3UtkeQvzAI4Vne7xC8x6ou6Bkkue_NxCUWs4bA_4g | 5 | — |
| TXT | concepts.app | v=spf1 a mx mx:mail.helpshift.com google-site-verification=XkFXwODRzBQ_icQ_-6ByTeyGxqshWRZYAGpu_OymyA4 include:servers.mcsv.net include:spf.mandrillapp.com ~all | 5 | — |
| DMARC | _dmarc.concepts.app | v=DMARC1; p=none; sp=none; rua=mailto:[email protected]; pct=100 | 300 | — |
 TLS and certificates
| Assessment | Normal configuration |
|---|---|
| Supported protocols | TLSv1.2、TLSv1.3 |
| Negotiated protocol | TLSv1.3 |
| Certificate subject | *.concepts.app |
| Issuer | Sectigo Limited |
| Valid until | 2027-01-22T23:59 · Remaining when checked: 118 days |
| Verification details | Certificate trust: Passed · Hostname match: Passed |
 HTTP response headers
| Header | Value |
|---|---|
| content-type | text/html; charset=utf-8 |
| content-language | en |
| cache-control | max-age=3600 |
| server | nginx/1.30.4 |
| strict-transport-security | max-age=31536000; includeSubDomains |
| x-frame-options | SAMEORIGIN |
| x-content-type-options | nosniff |
| referrer-policy | same-origin |
| set-cookie | Redacted |
 Identified technologies
User reviews (0)