Website profiles · Technology insights · Alternatives

console-ninja.com

Console Ninja VS Code extension allows you to see console.log output and runtime errors right next to your code.

Paid content
Visit website
Profile views 8 Outbound visits 1 Normal
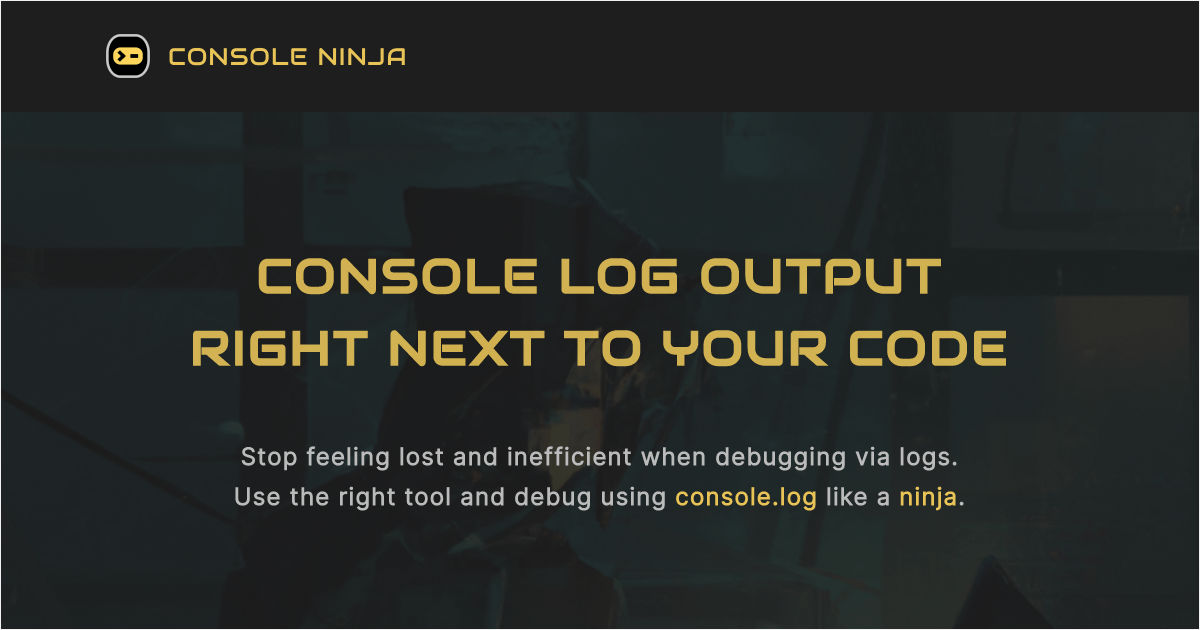
Console log output right next to your code Full homepage screenshot

At a glance

Category
Development
Language
English
Paid-content signal
Paid contentObserved
Registered
2022
Hosting
Amazon CloudFrontInferred
HTTPS certificate trusted
PassedObserved
Last updated

Website review

This review may include AI-generated content and is not individually verified. Domain, certificate and other facts come from the observed data on this page.

What is Console Ninja?

Console Ninja is a VS Code extension that shows console.log output and runtime errors directly beside the line of code that produced them, instead of only in the Debug Console or terminal.

What it changes in practice

Normally, when you add a console.log while debugging, you have to switch to the Debug Console or terminal, match the value to the right log statement, and scroll through noisy output. Console Ninja puts the value inline in the editor, next to the relevant line, so you keep your place in the code.

It covers two common cases:

  • Log values — the result of a console.log appears next to that statement as you run your code.
  • Runtime errors — errors surface next to the line that threw them, rather than only in a separate panel.

Who gets the most out of it

Situation Likely benefit
Debugging Node.js or browser-based JavaScript/TypeScript High — inline values reduce context switching
Working in a large file with many logs High — output stays tied to its line
Occasional quick scripts Lower — the Debug Console may be enough
Teams that standardize on one debugger setup Worth checking fit before adopting

A concrete scenario

You are fixing a function that returns undefined for some inputs. You add three console.log calls at different points. With Console Ninja, each printed value appears next to its own line, so you can see where the data stops being what you expect without leaving the editor or counting log lines in a terminal.

Next step

Install the extension, add one console.log to a small file you are already running, and see whether the inline output matches how you like to debug. If you want to know what the paid tier adds, check the Console Ninja site directly, since feature limits can change between versions.

How does Console Ninja display console.log output next to my code?

Console Ninja shows console.log output and runtime errors directly in the editor gutter, inline with the line of code that produced them. Instead of switching to the browser's DevTools console or the VS Code terminal, you see the value appear beside the statement as soon as it runs.

Console Ninja works by connecting your running JavaScript or TypeScript process to the VS Code extension. When a console.log executes, the value is captured and rendered next to the corresponding source line. The same mechanism surfaces runtime errors at the line where they were thrown.

H3 How this changes a debugging session

A typical loop looks like this:

  1. Add console.log(user) inside a function.
  2. Trigger the code path in your app.
  3. Read the logged value inline, without leaving the file.
  4. Edit, save, and watch the inline output update.

The practical gain is fewer context switches. You keep your place in the source file and can compare logged values across several lines at once, which is awkward in a scrolling DevTools console.

H3 What it is good for, and where it is not enough

  • Best fit: day-to-day inspection of values in Node.js services, front-end bundles, and test runs where you already rely on console.log.
  • Weaker fit: deep async tracing, memory profiling, or stepping through complex state transitions. For those, the VS Code debugger's breakpoints and call stack remain the stronger tool.
  • Watch out for: noisy logs. Inline output is most useful when logs are deliberate; leaving many behind can clutter the gutter.

H3 A quick way to try it

Install the extension, open a small project, and put a single console.log in a function you can trigger easily. If the value appears beside the line, the connection is working; if not, check that your process is running in a mode the extension can attach to. From there, expand to a handful of logs in one file and judge whether the inline view saves you more time than it costs in visual noise.

Does Console Ninja work with languages other than JavaScript?

Console Ninja is built around JavaScript and TypeScript runtimes. Its core trick—displaying console.log output and runtime errors inline, right next to the line of code that produced them—depends on hooking into a JS runtime (Node.js, and browser/Deno/Bun-style environments). For those languages, that inline feedback is the whole point of the extension.

For other languages, the answer is generally no, not in the same way. A language like Python, Go, Ruby, or Java has its own runtime and its own debugging/output conventions, and Console Ninja does not claim to instrument them. So if your project is Python-heavy, don't expect Console Ninja to show Python print() output beside your code.

If you work in a mixed codebase

A practical scenario: you maintain a Node.js backend plus a Python data-processing script. Console Ninja can help with the Node side; for Python you'd fall back to its own tooling (for example, a Python debugger or integrated terminal output). The extension won't unify both.

Decision criterion

  • JavaScript/TypeScript (Node, browser, Deno, Bun): Console Ninja is designed for this and is worth trying.
  • Other languages: look for a language-specific debugger or inline-output tool instead.

A useful next step is to check the runtime your project actually uses before installing. If it's not a JS runtime, Console Ninja won't add much. You can review the extension's stated scope at Console Ninja.

Is Console Ninja free or does it have a paid Pro version?

Console Ninja has both a free tier and a paid Pro version. The free extension is the core experience: it shows console.log output and runtime errors inline, right next to the relevant line in VS Code, instead of making you switch to the Debug Console or terminal. The Pro version is positioned as an upgrade for developers who want more than that basic inline logging.

So the practical answer is: yes, you can use it for free, and yes, there is a Pro option. The free tier is the sensible starting point if you mainly want to stop jumping between your editor and a separate console panel.

How to decide

  • Start free if you just want inline console.log values and runtime errors while editing. That is the core value and it does not require payment.
  • Consider Pro if the free inline output leaves you wanting more control, persistence, or team-oriented features. Check the official Pro page for the current feature list, since paid tiers change over time.

A concrete scenario

Imagine you are debugging a React component and you add several console.log calls. With the free extension, the values appear directly beside those lines, so you can scan them without losing your place. If you later need to inspect output across a larger session or share a richer debugging setup with teammates, that is when you would evaluate Pro.

Next step

Install the free extension, use it on one real bug, and note what you still have to do manually. Then compare that gap against the Pro feature list at Console Ninja to see whether the paid tier actually solves your problem.

How do I install and set up Console Ninja in VS Code?

Install Console Ninja as a VS Code extension, then open a JavaScript or TypeScript project and run it from VS Code's debugger. The extension shows console.log output and runtime errors inline, next to the line that produced them, instead of making you switch to the Debug Console or terminal.

Setup steps

  1. In VS Code, open the Extensions view (Ctrl+Shift+X on Windows/Linux, Cmd+Shift+X on macOS) and search for Console Ninja. Install the extension published for console-ninja.com.
  2. Reload VS Code if prompted.
  3. Open a project folder containing a Node.js or browser JavaScript/TypeScript app.
  4. Start your app through VS Code's Run and Debug panel (or an existing launch configuration) rather than only from an external terminal. Inline output depends on the extension hooking into the runtime.
  5. Add a console.log(...) in your code and trigger that path. The value should appear as an inline annotation at that line.

Practical notes

  • If nothing appears, confirm the app is actually running under the debugger and that the logged line executes. Logs inside code paths that never run won't show.
  • Inline output is most useful for tight edit-run loops: logging a variable, seeing it beside the source, adjusting, and repeating without leaving the editor.
  • Some capabilities are positioned as PRO features on the project's pricing page; check Console Ninja for the current free/PRO split before relying on a specific feature in a team workflow.

When it fits

This suits developers who already debug inside VS Code and want log output kept in context. If your team runs apps mainly from a terminal or CI, or you prefer a full logging pipeline, the inline approach adds less value.

Can Console Ninja show runtime errors as well as console.log output?

Yes. Console Ninja is built to surface runtime errors alongside your console.log output, placing both next to the relevant line of code rather than only in a separate terminal or Debug Console.

What that looks like in practice

  • console.log values appear inline near the statement that produced them, so you don't have to jump between the editor and an external panel.
  • Runtime errors are shown in the same inline context, which helps you connect an exception to the exact file and line where it occurred.
  • Because both appear together, a typical debugging loop becomes: run the app, read the logged values and the error at the same spot, edit, repeat.

Who benefits most

  • Frontend and Node.js developers who already debug heavily with console.log and want less window-switching.
  • People new to a codebase who benefit from seeing values and failures in the context of the source line.
  • Teams doing quick iterative work where opening a full debugger for every check feels heavy.

Trade-offs to weigh

  • Inline output is excellent for fast, low-ceremony inspection, but it is not a replacement for a full debugger when you need breakpoints, call stacks, or step-through execution.
  • Very chatty logging can clutter the editor, so it works best when you log deliberately.
  • Setup and framework support matter: confirm it works with your runtime and bundler before relying on it.

Practical next step

Install the extension, add a console.log and deliberately trigger an error in a small file, then check whether both appear inline as expected. If they do, adopt it for day-to-day logging; keep your debugger for deep call-stack work. You can review the extension's own feature list, including its PRO features, to see what is included beyond the free tier.

Related questions

More questions →
What Kind of Console Output and Errors Can Console Ninja Display?

Console Ninja displays console.log output and runtime errors directly next to the source line that produced them, inside VS Code. It works with code running in Node.js and browser-based projects, and the values update as the code runs — so you read results in the editor instead of switching to a terminal, browser devtools, or debug console.

What it shows

The extension's stated purpose is narrow and specific: it surfaces two categories of runtime information inline.

console.log output

When your code calls console.log, the logged value appears next to the line that made the call. This covers the ordinary logging you already write — no new logging API to learn. Because the output is anchored to the source line, you don't have to match a terminal line back to a file and line number yourself.

Runtime errors

Errors thrown while the code runs are surfaced inline as well. Instead of hunting through a stack trace in a separate panel, you see the failure at the location it relates to in your source.

Where it applies

Environment Covered
Node.js projects Yes
Browser-based projects Yes

The extension is a VS Code extension, so the inline display happens in the editor. The code itself still runs in its normal runtime — Node.js or the browser — and Console Ninja reads the output from there.

How the output behaves

Values update as the code runs. That matters for anything that executes more than once:

  • A log inside a loop or a frequently called function refreshes rather than piling up duplicate lines.
  • A log inside an event handler reflects the latest invocation.
  • A value that changes over the life of the process shows its current state next to the line.

The practical effect is that you keep your attention in the editor: write the log, run the code, read the result on the spot, adjust, repeat.

What this means for your workflow

The main thing Console Ninja changes is where you look, not what you write. You keep using console.log and you keep getting real runtime errors; you just stop context-switching to a separate output surface to read them.

Two consequences worth knowing before you adopt it:

  • It complements, not replaces, a debugger. Inline logs and errors are for reading values and spotting failures quickly. Stepping through execution and inspecting scope is a different job.
  • Some features sit behind a paid tier. The site links to a "PRO features" page, so if a specific capability matters to you, check that page rather than assuming everything is in the free extension.

If your goal is simply to see console.log results and runtime errors next to the code that produces them while working in Node.js or the browser, that is exactly the scope Console Ninja covers.

What Does a Postal Code API Return? Fields, Formats, and Common Use Cases

A postal code API returns structured location data for a given ZIP Code or Canadian postal code. A typical response includes the code itself, city, state or province, county, latitude/longitude, and — where available — ZIP+4 detail. More complete services add time zone, area codes, boundary geometry, and demographic fields. You send a code (or an address), and the API sends back a machine-readable record you can store, validate, or display.

This article explains what those responses contain, how requests are usually shaped, and where postal code data fits into real applications.

First, clear up the word "code"

The keyword "code" is overloaded, and that causes real confusion for developers:

  • Postal code — the ZIP Code (U.S.) or postal code (Canada) that identifies a delivery area.
  • API key — the credential you use to authenticate your requests. It is not postal data.
  • Source code — the program you write to call the API.

When someone searches for "postal code API code," they usually want example request/response code for a postal code service. The rest of this article treats it that way.

What a postal code API actually returns

Response fields vary by provider and endpoint, but the core set is fairly consistent. A single-code lookup commonly returns:

Field Example Notes
Postal code 90210 The code you queried
City Beverly Hills May be one of several acceptable place names
State / Province CA Two-letter abbreviation
County Los Angeles Useful for tax, territory, and reporting logic
Latitude / Longitude 34.0901, -118.4065 Usually the centroid of the area
ZIP+4 90210-1234 Present only when a specific delivery segment is known
Time zone America/Los_Angeles Helps with scheduling and display
Area codes 310, 424 Regional phone context

Richer datasets add 90+ fields: boundaries, population, income, elevation, and more. You rarely need all of them — request only what your application uses.

A representative JSON response

{
  "postal_code": "90210",
  "city": "Beverly Hills",
  "state": "CA",
  "county": "Los Angeles",
  "latitude": 34.0901,
  "longitude": -118.4065,
  "timezone": "America/Los_Angeles",
  "area_codes": ["310", "424"]
}

XML responses carry the same information in tag form. Choose based on what your stack parses most easily; JSON is the common default.

Common request patterns

Most postal code APIs support four patterns. Knowing which one you need prevents wasted calls.

1. Lookup by code

You have a code and want its details. This is the simplest and fastest call.

GET /lookup?code=90210

2. Reverse lookup by address

You have a street address and want to confirm or complete the code. This is the pattern behind checkout address validation.

GET /validate?street=...&city=...&state=...

3. Radius search

You have a center point and want all codes within a distance. Useful for store locators and delivery zones.

GET /radius?code=90210&miles=10

4. Batch validation

You have a file of addresses and want them cleaned in bulk. Batch endpoints trade latency for throughput and usually have their own limits.

Handling missing and ambiguous matches

Real data is messy. Plan for these cases:

  • No match — the code doesn't exist or the address is malformed. Return a clear error rather than a silent empty object.
  • Multiple matches — a city name may map to several codes, or a code may span several acceptable city names. Decide whether to pick the primary or return a list.
  • Partial match — the street is valid but the ZIP+4 isn't. Fall back to the 5-digit code.
  • Stale data — codes are added, retired, and reassigned. Refresh your dataset on a regular schedule.

A practical rule: validate at the point of entry, store the normalized result, and never re-derive it later from raw user input.

Practical use cases

  • Checkout address validation — catch typos before shipping, reduce failed deliveries.
  • Shipping zone lookup — map a code to a zone, carrier route, or rate table.
  • Data enrichment — append county, coordinates, or demographics to existing records.
  • Store and service locators — radius search to find nearby branches or coverage areas.
  • Territory and tax logic — county and boundary data drive jurisdiction rules.

Licensing and data-source considerations

Postal code data originates with national authorities — USPS in the United States and Canada Post in Canada. Providers license and repackage it, which is why accuracy, update frequency, and field coverage differ between services. Before committing:

  • Confirm the data source and how often it refreshes.
  • Check whether ZIP+4 and boundary data are included or sold separately.
  • Review usage limits and whether batch processing is allowed.
  • Read the license terms for redistribution and storage.

Pricing and plan details change, so check the provider's current documentation rather than relying on secondhand figures.

Getting started

  1. Decide which request pattern you need (lookup, reverse, radius, or batch).
  2. Pick the fields you'll actually store.
  3. Write a small test call and inspect the raw response.
  4. Add error handling for no-match and ambiguous cases.
  5. Cache results where the same codes repeat.

A postal code API is ultimately a translation layer: you give it a code or an address, and it gives back structured location facts. Understand the fields, match them to your use case, and handle the messy edges — that's most of the work.

What Is Console Ninja?

Console Ninja is a VS Code extension that displays console.log output and runtime errors directly next to the line of code that produced them, instead of in the browser DevTools or an integrated terminal. It is aimed at JavaScript and TypeScript developers who debug inside VS Code and want to avoid switching windows to read log output. The extension is available in a free version, with a separate Pro tier offering additional features.

The problem it solves

The normal debugging loop for front-end and Node.js code looks like this:

  1. Add a console.log(...) statement.
  2. Run the app.
  3. Switch to the browser console or terminal.
  4. Find the matching log line among unrelated output.
  5. Switch back to the editor to change the code.

Steps 3 and 4 are the friction. When several logs fire, or when the same log runs repeatedly, matching output to source becomes guesswork. Console Ninja collapses that loop by rendering the value in the editor gutter or inline, on the same line as the console.log call.

How it works in practice

The extension hooks into your running JavaScript or TypeScript process and streams log values and runtime errors back to VS Code, where they are anchored to the originating source location.

  • Input: your existing console.log calls and any runtime errors thrown by the running app.
  • Action: Console Ninja captures that output and maps it to the source line.
  • Expected result: the logged value or error appears next to the code, so you read it without leaving the editor.

Because it reuses console.log rather than a proprietary API, you generally do not need to rewrite logging statements to get inline output.

Who it is for

You are… Console Ninja is useful if…
A front-end developer debugging in VS Code You want log values visible without opening browser DevTools
A Node.js/TypeScript developer You want runtime errors surfaced at the throwing line
Someone who logs frequently while iterating You want to correlate repeated logs to their source quickly
A developer who rarely uses console.log The benefit is smaller; your existing debugger may suffice

Free vs Pro

The extension ships as a free VS Code extension, and the site links to a separate Pro features page. The available material confirms a free tier and a distinct Pro tier but does not list specific Pro capabilities here. If your decision depends on which features are gated, check the Pro page directly rather than assuming a particular feature is free.

When it is not the right tool

  • You need full step-through debugging with breakpoints, call stacks, and watch expressions — a debugger is the better fit, and Console Ninja is complementary rather than a replacement.
  • You work outside VS Code — the extension is VS Code-specific.
  • Your logs come from a language or runtime the extension does not instrument.

Getting started

  1. Install the Console Ninja extension from the VS Code Marketplace.
  2. Open a JavaScript or TypeScript project and start your app as usual.
  3. Add or keep a console.log statement and trigger the code path.
  4. Look next to the source line for the output; if nothing appears, confirm the app is actually running and that the extension has attached to the process.

The main thing to verify is that the running process is the one Console Ninja is watching — a common reason inline output does not show up is that the app was started before the extension attached, or a different process is serving the code.

Is Console Ninja Suitable for Your JavaScript or TypeScript Project?

Console Ninja is a VS Code extension that shows console.log output and runtime errors directly next to the line of code that produced them, instead of in a separate terminal or browser console. It fits JavaScript and TypeScript projects where you run code from inside VS Code and want faster feedback while debugging. It is not a replacement for a full debugger, and it only helps when your code is actually executing — reading static files alone produces no output.

What Console Ninja actually does

The extension intercepts console output and runtime errors from your running code and renders them inline, next to the relevant source line. According to the project's own description, it "allows you to see console.log output and runtime errors right next to your code."

That single behavior drives most of its value:

  • You stop switching between the editor and a terminal or browser DevTools to correlate a log line with its source.
  • Runtime errors appear at the location that threw them, not only in a stack trace.
  • Feedback is tied to execution, so it updates as you run and re-run your code.

Who it suits

Console Ninja tends to fit these situations well:

  • Node.js and browser debugging workflows where you already lean on console.log rather than breakpoints.
  • VS Code users — it is a VS Code extension, so editor compatibility is a precondition, not an afterthought.
  • JS/TS projects that you run from within VS Code, since output depends on code executing in that environment.

It is a weaker fit if you debug primarily through a standalone browser DevTools session, a different editor, or a remote/CI environment where code does not run inside VS Code.

What output and errors it can surface

The extension is built around two categories of runtime feedback:

Category What you see Where it appears
Console output console.log and similar console calls Next to the source line that logged it
Runtime errors Errors thrown while code runs Next to the code that produced them

The practical effect is that both your intentional logs and your unexpected failures land in the same place — the code — rather than being split across tools.

Requirements before adopting

Before you commit, confirm these conditions hold for your setup:

  1. You use VS Code. The extension targets that editor.
  2. Your code runs in VS Code, not only in an external process you never launch from the editor.
  3. Your project is JavaScript or TypeScript. The workflow is built around JS/TS console and runtime behavior.
  4. You want inline feedback, not a full step-through debugger.

If any of these fail, the extension's core benefit — output next to your code — does not materialize.

Free vs Pro

Console Ninja offers a free tier and a Pro tier; the site links to a dedicated "PRO features" page at console-ninja.com/pro. The available source material does not enumerate which capabilities sit behind Pro, so treat the free/Pro split as something to verify on that page before deciding. What the description does establish is the core free-facing behavior: inline console output and runtime errors in VS Code.

How to decide

Use this as a quick filter:

  • Adopt it if you write JS/TS, work in VS Code, run your code there, and spend time matching logs to source lines.
  • Try it first if you are unsure whether your run configuration executes code inside VS Code — the extension only helps when it does.
  • Skip it if you debug mainly in browser DevTools, use another editor, or need a full interactive debugger rather than inline logs.

The deciding question is simple: does your code run inside VS Code while you work? If yes, Console Ninja's inline output is likely to save you context-switching. If no, its main feature has nothing to attach to.

Console Ninja Free vs Pro: What's the Difference?

Console Ninja's free VS Code extension shows console.log output and runtime errors inline, right next to the code that produced them. The Pro tier, listed at console-ninja.com/pro, adds features aimed at larger or more complex debugging workflows. The site does not publish a feature-by-feature comparison table or pricing on the pages available here, so the practical answer is: start with the free extension, and check the official Pro page for the current feature list and price before deciding whether to upgrade.

What the free extension covers

Based on the site's own description, the free Console Ninja VS Code extension lets you:

  • See console.log output rendered next to the corresponding line in your editor, instead of switching to a terminal or browser devtools.
  • See runtime errors in the same inline position, so a thrown exception points back to the line that caused it.

That covers the core loop most developers hit daily: log something, run the app, read the value without leaving the editor.

What Pro adds

The site links to a dedicated Pro page (console-ninja.com/pro) under "PRO features." That page is the authoritative source for what Pro includes and what it costs. Because the feature list and pricing are not reproduced in the material available here, treat the Pro page as the thing to read — not a secondhand summary — before you buy.

How to decide

Question If yes If no
Does inline console.log + error display already solve your debugging loop? Stay on free Look at Pro
Do you hit limits the free tier doesn't cover (per the Pro page)? Evaluate Pro Stay on free
Is the Pro price justified by features you'll actually use weekly? Upgrade Stay on free

The decision hinges on one thing: whether the specific Pro features map to work you do often. A feature you'd use once a month rarely justifies a paid tier; one you'd use every session usually does.

Before you upgrade

  1. Install the free extension and use it on a real project for a few days.
  2. Note where it stops being enough — that gap is what you're actually paying Pro to close.
  3. Open console-ninja.com/pro and match that gap against the listed features and price.
  4. If the listed features don't clearly address your gap, don't upgrade yet.

Common sticking points

  • Assuming Pro is required for basic use. The free extension is the product's core: inline logs and errors. Pro is an add-on layer, not a prerequisite.
  • Relying on outdated feature lists. Pro features and pricing change; the Pro page is the only current source.
  • Upgrading before installing. You can't judge the gap between free and Pro without first running free on your own code.

If you only need to stop alt-tabbing to a terminal to read log values, the free extension is the answer. If the Pro page lists something your workflow specifically needs, that's the signal to pay.

Website Overview

Page metadata, canonical configuration and social previews work together to provide more consistent search and sharing presentation.

Domain and Registration

Transfer-protection status is present, helping reduce the risk of unauthorized domain transfers. The domain has about 4 years of registration history; its current configuration provides more context than age alone. The registrar is GoDaddy.com, LLC, a widely used domain service provider. The domain uses the common .com extension, which is not an independent safety signal.

DNS and Email

The lowest TTL is 21 seconds, supporting rapid record changes at the cost of more frequent lookups. Nameservers are provided by Cloudflare, indicating managed DNS hosting. No CNAME was found; the observed records resolve directly to addresses. No MX record was found. A conventional explicit inbound-mail route is not configured. TXT records include verification markers for Google. Such markers may also remain after a service stops being used.

TLS and Certificates

The certificate uses an RSA 2048-bit public key, offering broad client compatibility. The server supplied a complete certificate chain. No organization name is present in the certificate; the available fields are consistent with domain validation. The certificate was issued within the Amazon cloud or CDN ecosystem. The certificate is valid for about 197 days in total, with 181 days remaining.

HTTP and Browser Security

The response lacks these common security headers: CSP, Permissions-Policy. No X-Powered-By header was found, reducing one common source of backend fingerprinting information. The x-cache, via response header indicates a CDN or caching proxy in the delivery path. No obvious internal addresses or debug information were found in the headers. The Server header contains the custom value CloudFront.

Technology Stack Analysis

The public page identifies Amazon CloudFront without precise versions, leaving fewer clues for version-specific scanning.

Search and Social Sharing

Twitter Card metadata is configured. The title has 42 characters, within a common display range. A meta description is present, with 112 characters. The observed directives allow indexing and link following. No Generator meta tag is publicly exposed.

Hosting and Email

DNSCloudflare
HostingAmazon CloudFront
EmailUnknown
Approximate IP geolocation (inferred; a CDN or proxy may differ from the origin server) United States flagUnited States Inferred 3.167.56.25

Registration details

RDAP / WHOIS

RegistrarGoDaddy.com, LLC
Registered2022-07-19
Expires2028-07-19
Domain statusclient delete prohibited、client renew prohibited、client transfer prohibited、client update prohibited
Nameserversadrian.ns.cloudflare.com、lynn.ns.cloudflare.com
DNSSECunsigned

DNS records

DNS

TypeNameValueTTLPriority
Aconsole-ninja.com3.167.56.2521—
Aconsole-ninja.com3.167.56.4321—
Aconsole-ninja.com3.167.56.9621—
Aconsole-ninja.com3.167.56.9921—
AAAAconsole-ninja.com2600:9000:27c5:2400:8:b6c1:6e00:93a160—
AAAAconsole-ninja.com2600:9000:27c5:3800:8:b6c1:6e00:93a160—
AAAAconsole-ninja.com2600:9000:27c5:5000:8:b6c1:6e00:93a160—
AAAAconsole-ninja.com2600:9000:27c5:7a00:8:b6c1:6e00:93a160—
AAAAconsole-ninja.com2600:9000:27c5:7c00:8:b6c1:6e00:93a160—
AAAAconsole-ninja.com2600:9000:27c5:9200:8:b6c1:6e00:93a160—
AAAAconsole-ninja.com2600:9000:27c5:9400:8:b6c1:6e00:93a160—
AAAAconsole-ninja.com2600:9000:27c5:a600:8:b6c1:6e00:93a160—
NSconsole-ninja.comadrian.ns.cloudflare.com86400—
NSconsole-ninja.comlynn.ns.cloudflare.com86400—
TXTconsole-ninja.comgoogle-site-verification=vcS1CloLu5gTkvgiJyYyEUb4XcdP6V-HYL4kDkyl2sU300—

TLS and certificates

TLS / SSL

AssessmentNormal configuration
Supported protocolsTLSv1.2、TLSv1.3
Negotiated protocolTLSv1.3
Certificate subjectconsole-ninja.com
IssuerAmazon
Valid until2027-03-31T23:59 · Remaining when checked: 181 days
Verification detailsCertificate trust: Passed · Hostname match: Passed

HTTP response headers

HTTP

HeaderValue
content-typetext/html
cache-controlmax-age=7200
serverCloudFront
strict-transport-securitymax-age=31536000
x-frame-optionsSAMEORIGIN
x-content-type-optionsnosniff
referrer-policystrict-origin-when-cross-origin

Identified technologies

Amazon CloudFront

Pages, Search and Sharing

Meta descriptionConsole Ninja VS Code extension allows you to see console.log output and runtime errors right next to your code.
Canonical URLhttps://console-ninja.com/
LanguageEnglish (default)
Twitter Cardsummary_large_image

Unknown

No sitemaps found

User reviews (0)

  • No reviews yet.