Website profiles · Technology insights · Alternatives

helicone.ai Paid content

Categories: Artificial Intelligence

Routing and monitoring for reliable AI apps - the LLMOps platform behind the fastest-growing AI companies.

Visit website

Updated: 2026-10-01 14:22 Language: English (default) Access: Normal

Profile views 1 Outbound visits 0
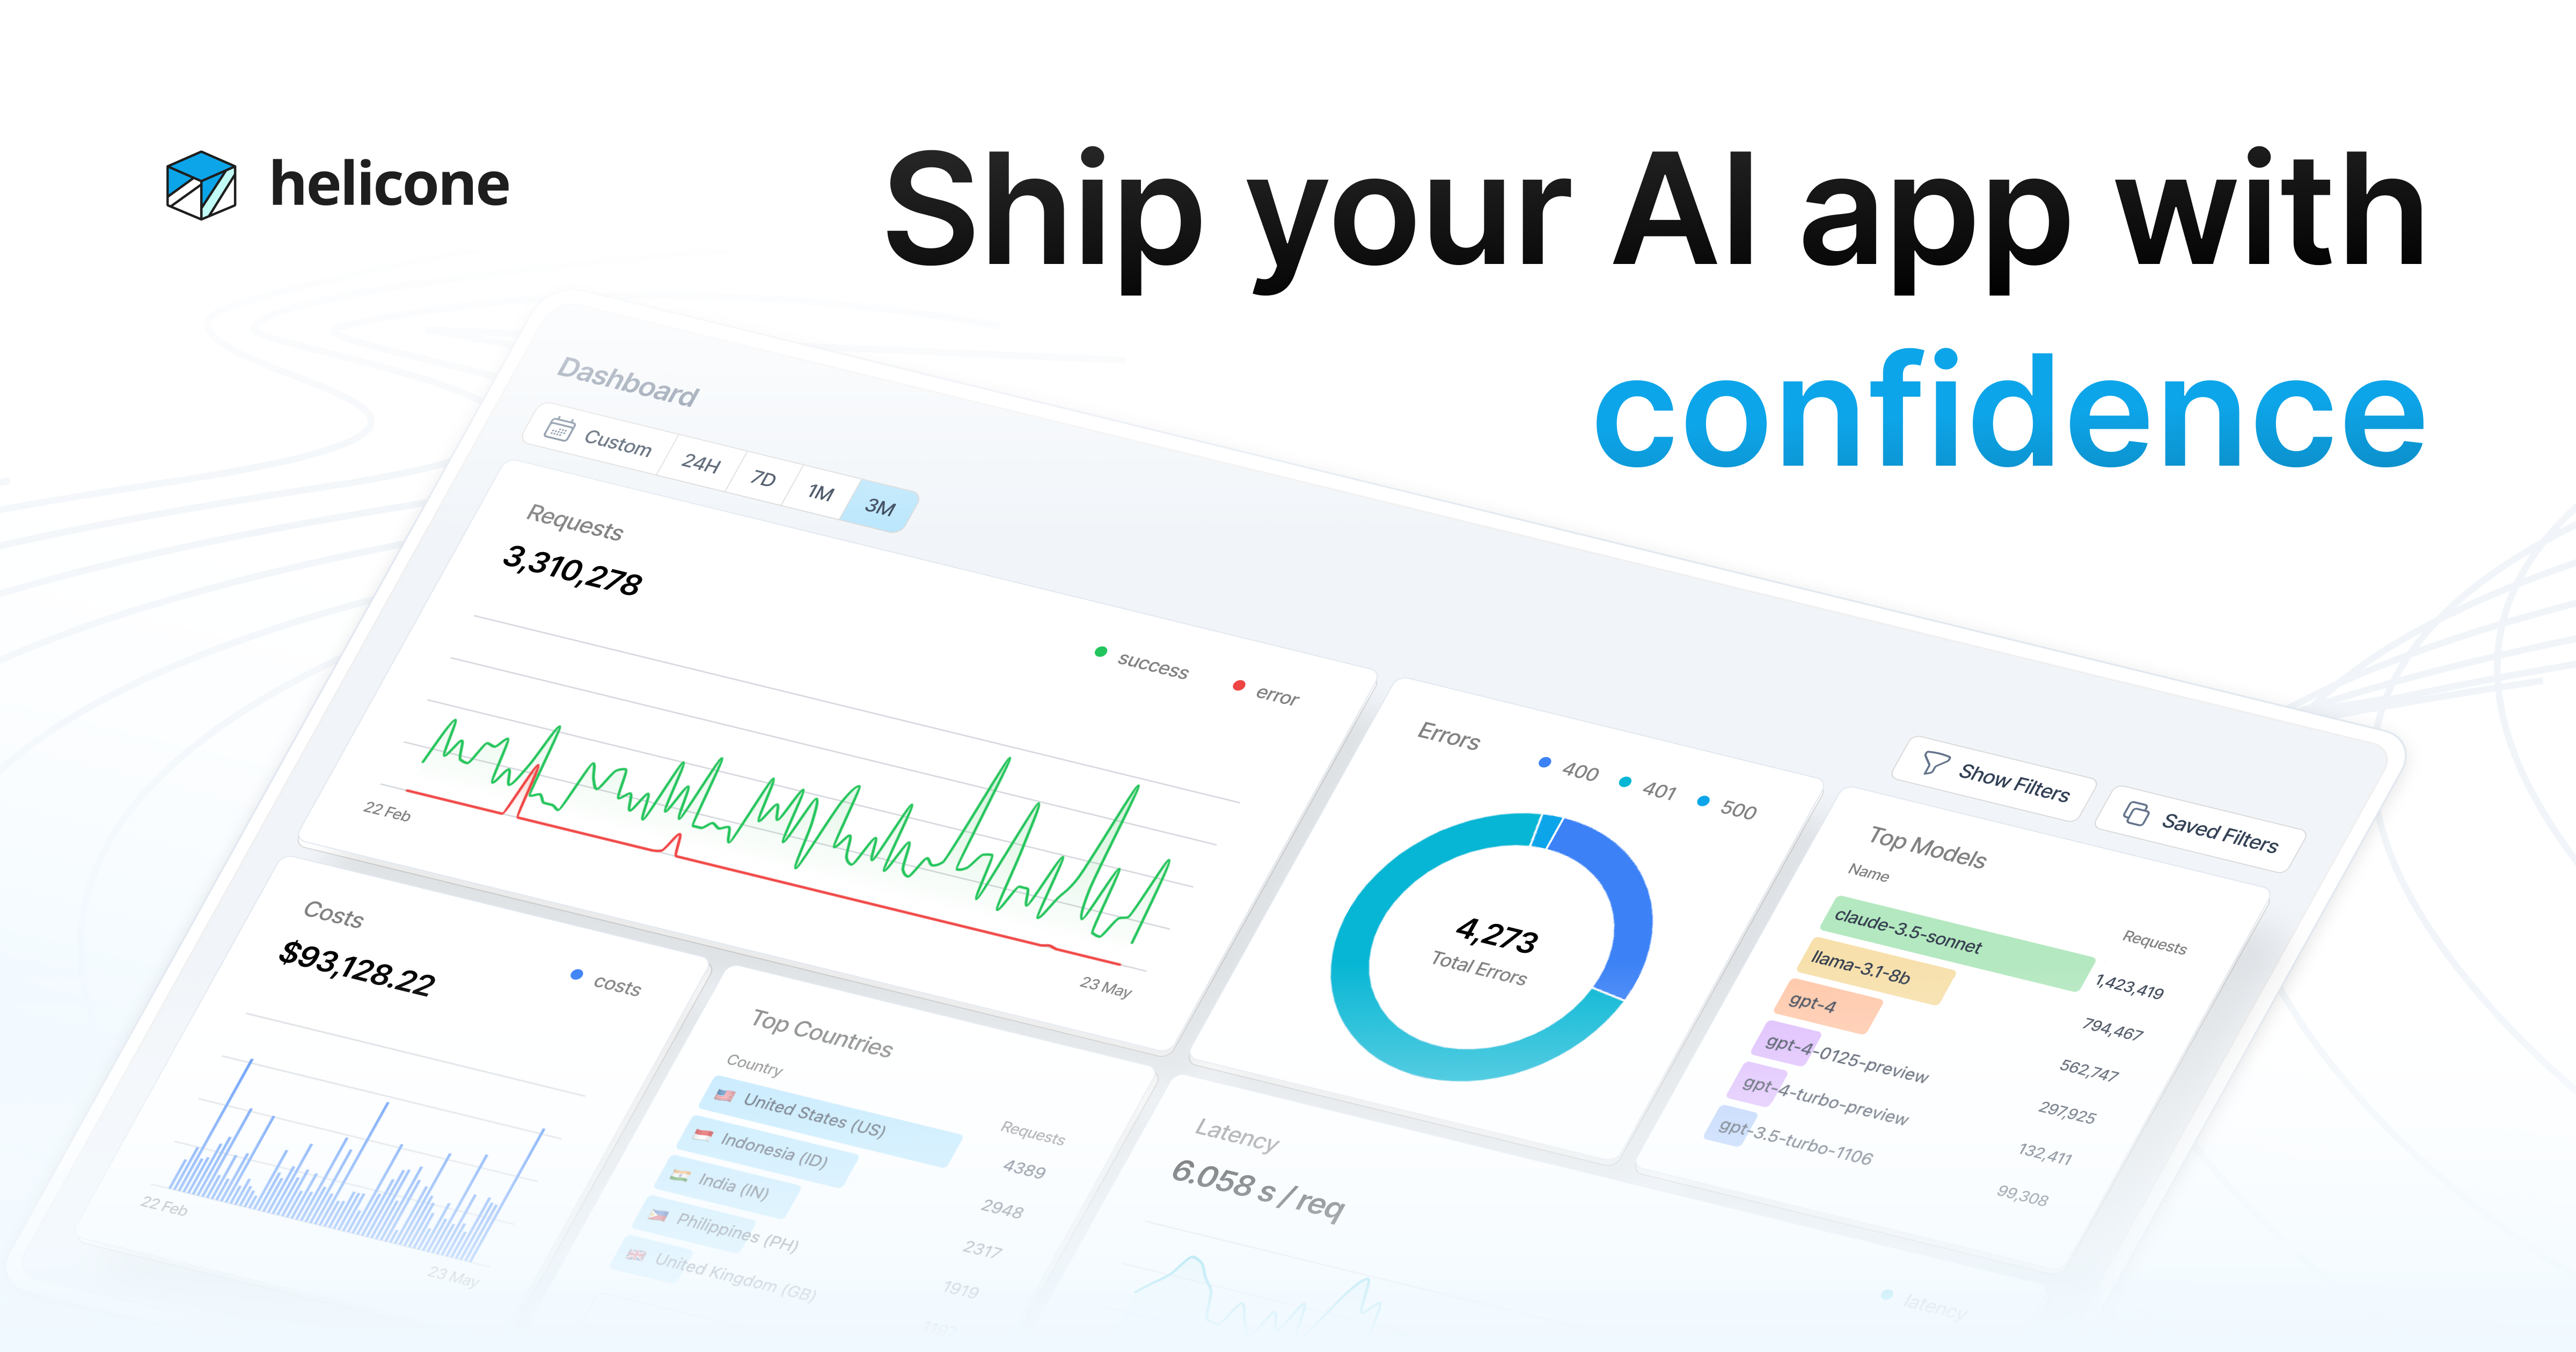
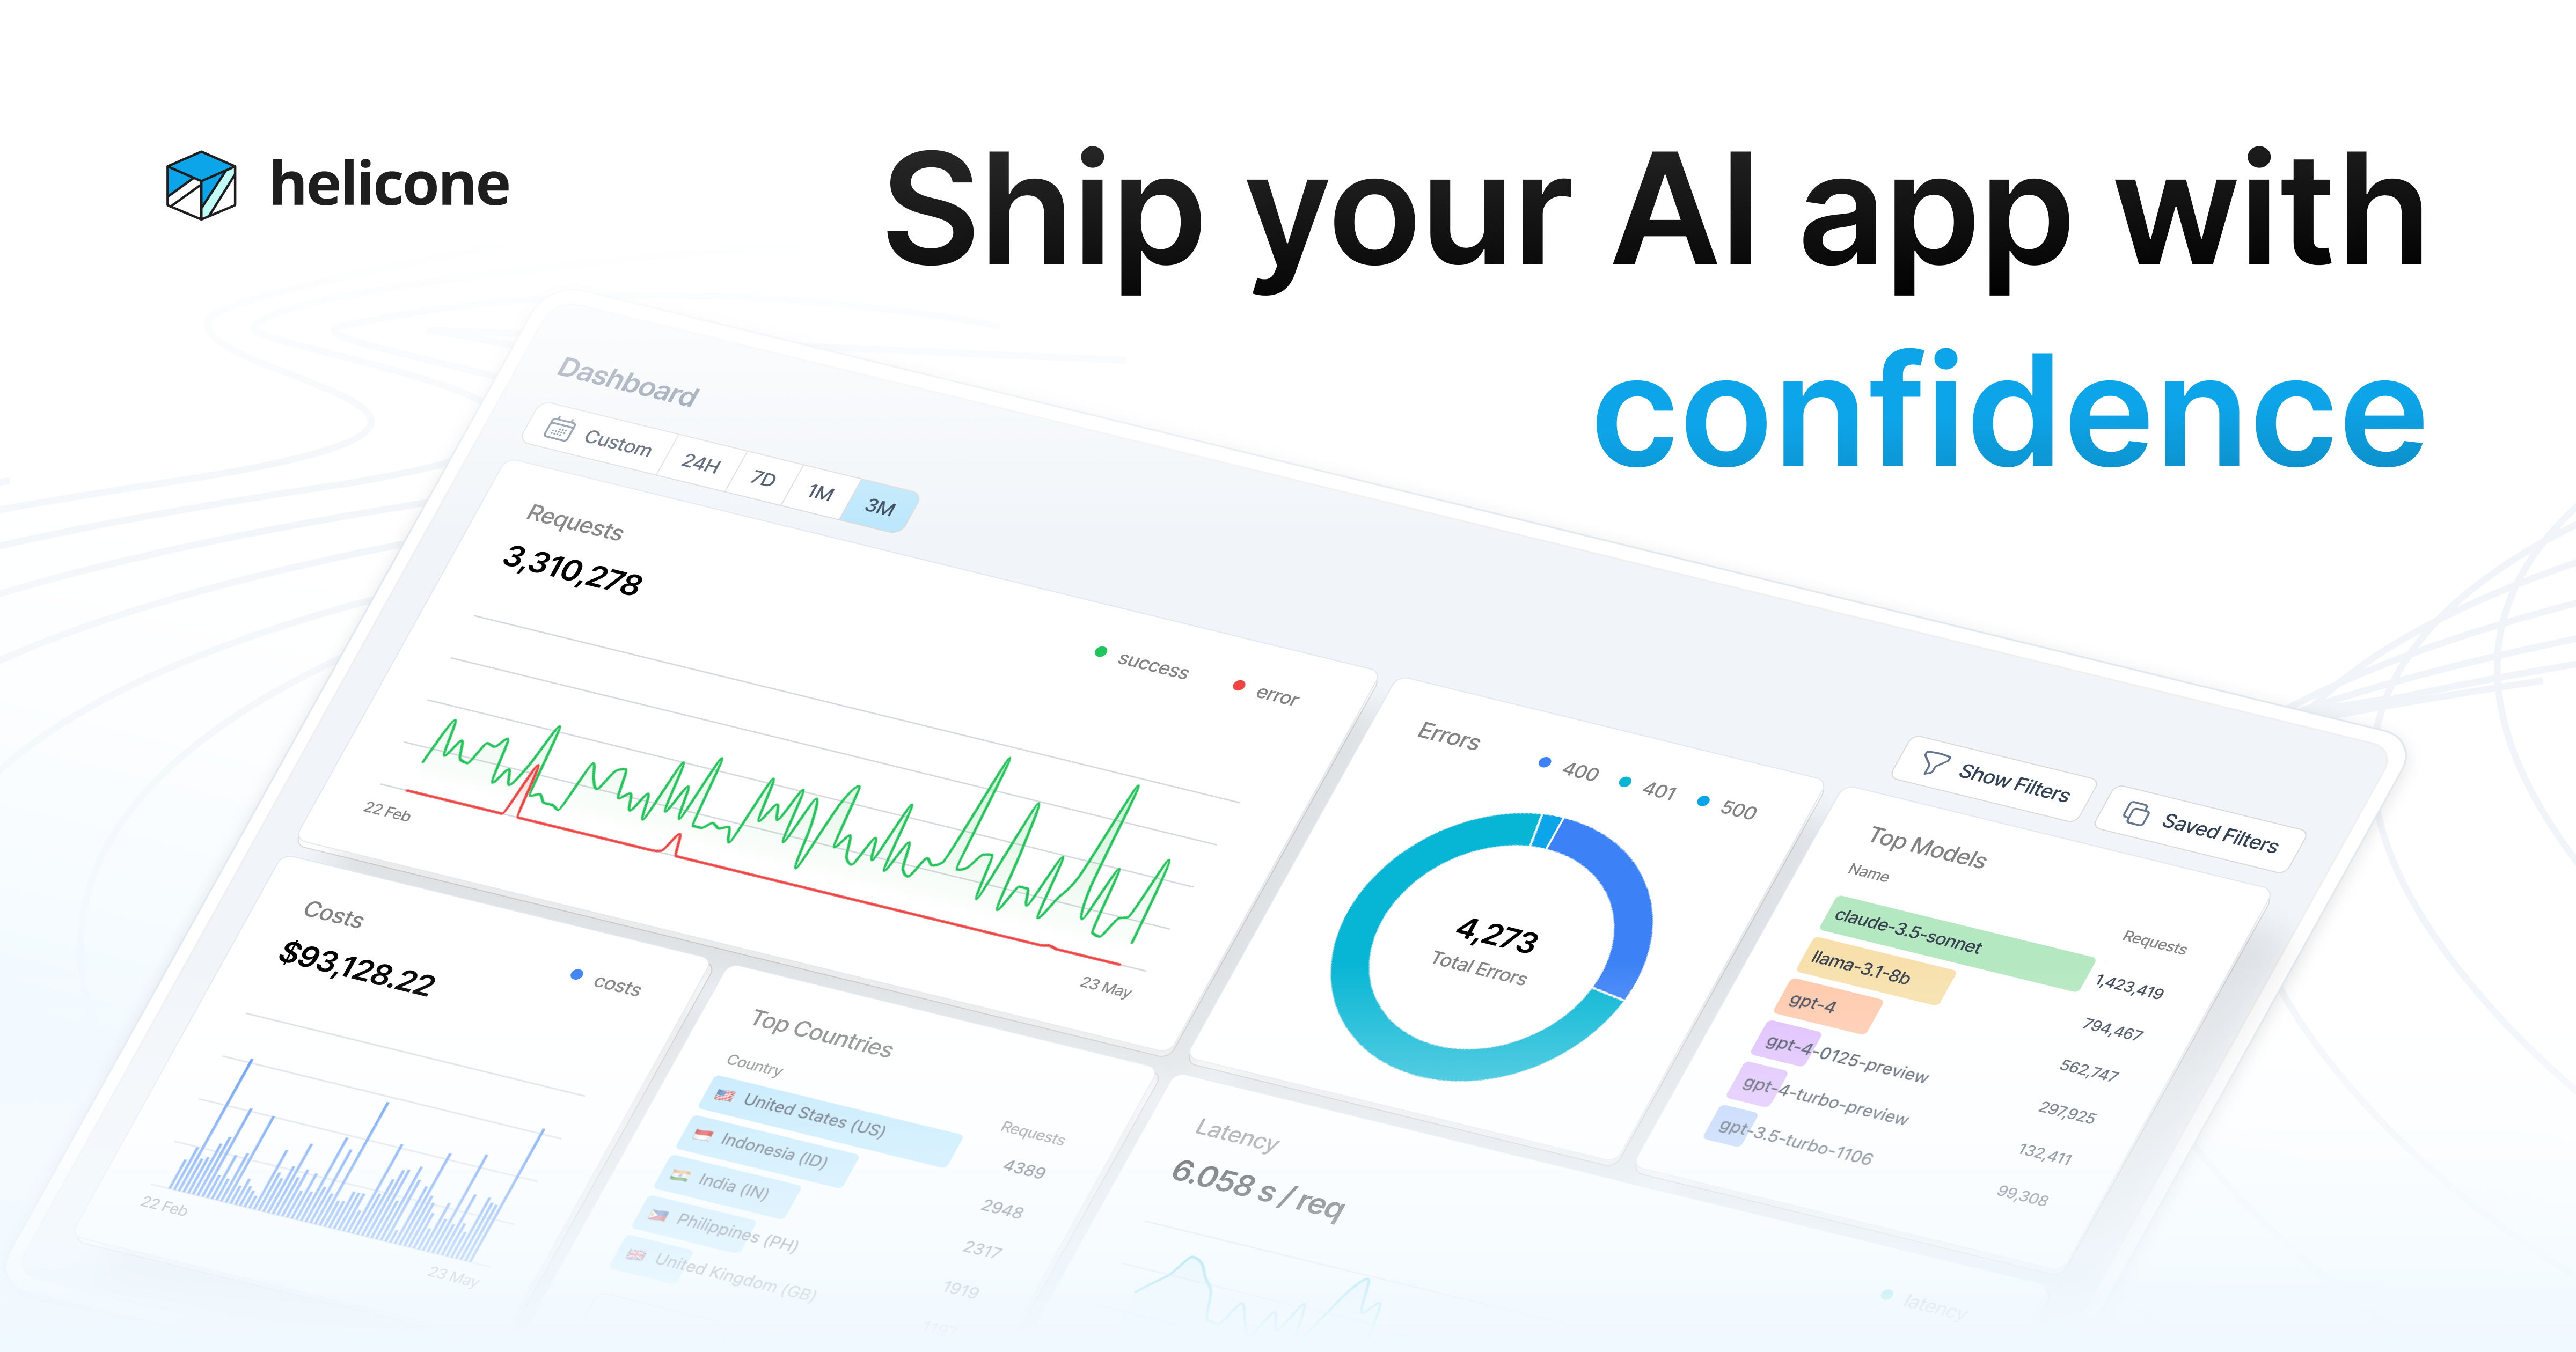
Helicone / AI Gateway & LLM Observability Full homepage screenshot
Editorial Review

Website Review

What is Helicone used for?

Helicone is an LLM observability and gateway platform: it sits between your application and AI providers to log requests, monitor performance and cost, and route traffic. Teams use it to see what their AI app is actually doing in production — which prompts run, how often requests fail or hit rate limits, and how users behave across sessions — then use those logs to debug and improve prompts.

Its two main jobs:

  • Observability: request-level logging, dashboards for requests, segments, sessions and users, plus a query language (HQL) for digging into logs, and alerts when things go wrong.
  • Gateway/routing: a proxy layer that manages provider calls, which is where rate limits, failover and traffic control come in. Monitoring and routing in one place means you don't have to stitch together a separate logging tool and proxy.

Who it suits: engineering teams shipping LLM features who need production visibility rather than just a local playground. It's less compelling for a solo prototype that hasn't left a notebook, or for teams that only need offline prompt experimentation.

A practical next step: pick one recurring problem — say, unexplained latency spikes or rising token spend — and check whether Helicone's request logs and alerts would have surfaced it faster than your current setup. If yes, the 7-day free trial (no credit card required) is enough to instrument one app and compare. For broader context on how this category is described, see Helicone.

How does Helicone help debug and analyze LLM applications?

Helicone helps debug and analyze LLM applications by acting as a gateway between your app and model providers: requests pass through it, and it records routing, request/response data, latency, errors and usage so you can inspect them in one dashboard. Its page evidence groups the work into three verbs — route, debug, analyze — with an AI dashboard covering Requests, Segments, Sessions, Users, and a query language called HQL, plus prompt-improvement tools such as Datasets and a Playground, and monitoring via Rate Limits and Alerts (Helicone / AI Gateway & LLM Observability).

H3 What that looks like in practice

  • Debugging: instead of reproducing a bug locally, you find the failing request in the Requests view, read the exact prompt and completion, and see whether the problem is a provider error, a timeout, or a prompt that behaved differently than expected.
  • Analysis: Sessions and Users let you follow a single conversation or a single customer across many calls, which matters when a complaint is "it got worse over the chat" rather than "this one call failed."
  • Cost and reliability monitoring: Rate Limits and Alerts turn observability into something proactive — you get told when spend or error rates move, rather than discovering it on the invoice.
  • Iteration: Datasets and Playground support the loop of testing a changed prompt against saved cases before shipping it.

H3 Who benefits most Teams already shipping an LLM feature to real users get the most value, because the pain Helicone addresses — an intermittent bad answer you cannot reproduce — only appears at volume. A solo developer prototyping one prompt may find a gateway adds a layer they do not yet need.

H3 A concrete scenario Suppose your support chatbot starts giving wrong refund answers for one enterprise customer. You filter Requests by that user, open the Session, and see that a retrieval step returned an empty context, so the model invented a policy. You save that case to a Dataset, adjust the prompt to say "if no context, escalate," and re-run it in the Playground before deploying.

H3 Trade-offs and decision criteria Routing traffic through a gateway means your prompts and completions are stored with a third party — check data-retention and redaction options against your own compliance rules before adopting it for sensitive workloads. Also weigh whether you need a full LLMOps platform or just logging; if you only want traces, lighter libraries may suffice.

Next step: run a small, non-sensitive feature through Helicone for a week and ask two questions — did you actually open the dashboard to investigate something, and did Sessions or Users answer a question your existing logs could not? If both are yes, expand it to production traffic. For a broader comparison of observability and gateway options, see Langfuse and Portkey.

How do I set up Helicone as an AI gateway for routing requests?

Helicone acts as a gateway you point your LLM calls at, so requests flow through it before reaching a provider. That lets you route, monitor and debug traffic from one place rather than wiring each provider separately. The page evidence shows the core surface area: Requests, Segments, Sessions, Users, HQL queries, Datasets, a Playground, plus Rate Limits and Alerts.

H3 How the setup generally works

  1. Create a Helicone account and generate an API key from the dashboard.
  2. Change your application's base URL to Helicone's gateway endpoint and add your Helicone key as a header, keeping your provider key as usual.
  3. Send a test request and confirm it appears under Requests in the dashboard.
  4. Configure routing rules — for example sending certain traffic to one provider and other traffic to another, or falling back when a provider errors.
  5. Add Rate Limits and Alerts so you catch cost spikes or failures before users do.

H3 What to route and why

Routing through a gateway is most useful when you have more than one model or provider, when you need per-user or per-team visibility, or when you want to switch providers without redeploying. Sessions and Users help you trace a single conversation or customer across many requests; Segments let you slice traffic by feature or tenant.

H3 Trade-offs to weigh

An extra hop adds a small amount of latency and one more dependency in your request path. It also means prompt and response data passes through a third party, so check your data-handling requirements before routing sensitive workloads. If you only call one provider and rarely change models, the benefit is mostly observability rather than routing.

H3 A concrete next step

Pick one non-critical endpoint, route it through the gateway, and watch Requests and Sessions for a day. If the visibility is useful, expand to your main traffic and add a fallback route. Helicone's own docs at Helicone cover the exact endpoint and header names for your SDK.

What pricing plans does Helicone offer and what does the free trial include?

Helicone offers a free trial rather than a fixed set of published plans in the information available here: the site promotes a 7-day free trial with no credit card required, and it links to a pricing page for current plan details. Because plan tiers, usage limits and paid options aren't specified in the available page evidence, you'll need to check Helicone's pricing page directly for the exact structure.

What the free trial includes

Based on the page evidence, the trial gives you access to the platform's core capabilities for 7 days, including:

  • Routing to direct requests across models or providers
  • Debugging tools
  • Analytics for usage and performance
  • Prompt improvement features such as datasets and a playground
  • Monitoring with rate limits and alerts

Practical next step

If you're evaluating Helicone for a small team or side project, start the 7-day trial and run your normal traffic through it for a few days, then check your usage against the pricing page before the trial ends. That gives you a realistic sense of cost and whether the observability features fit your workflow. For teams with steady production traffic, confirm whether the paid tiers are usage-based or seat-based, since that determines how predictably your bill scales.

How can I monitor rate limits and set up alerts in Helicone?

Rate limits and alerts are separate but connected jobs in Helicone: rate limits protect your app and upstream providers from traffic spikes, while alerts tell you when something needs attention. Both are configured per project, and the monitoring view is where you confirm they're actually working.

Monitoring rate limits

Helicone's dashboard exposes request volume, segments, sessions and users, so the practical approach is to watch those alongside your configured limits rather than in isolation.

  • Track volume against the limit. If you cap requests per user or per API key, watch the Requests and Users views to see which keys or users approach the ceiling before they hit it.
  • Segment the traffic. Use Segments to split by model, endpoint or customer, so a noisy tenant doesn't hide behind aggregate numbers.
  • Check sessions for bursts. Sessions show whether retries, agent loops or batch jobs are inflating request counts — a common reason limits trip unexpectedly.
  • Use HQL for custom queries. For anything the default charts don't cover (for example, requests per key per hour), write a query instead of eyeballing graphs.

Setting up alerts

Alerts in Helicone are threshold-based: you define a condition on a metric and get notified when it's crossed. A workable setup looks like this:

  1. Pick the metric that reflects the failure you care about — error rate, latency, cost, or request volume.
  2. Set the threshold slightly below the point of real damage, not at it. An alert that fires only when users are already affected is a post-mortem tool, not a warning.
  3. Scope it narrowly (one project, one model, one customer) so the signal stays actionable.
  4. Route it somewhere a human reads — a shared channel beats an inbox nobody checks overnight.

A concrete scenario

You run a customer-facing assistant on a per-seat plan and want to stop one account from consuming your provider quota. You set a rate limit on that account's key, then add an alert on request volume for that segment at roughly 80% of the limit. When it fires, you check the Sessions view: if the spike is a runaway retry loop in your own code, you fix the client; if it's genuine growth, you raise the limit and the plan. That distinction — self-inflicted versus real demand — is the main thing monitoring buys you.

Decision criteria

Goal What to use Why
Prevent quota exhaustion Rate limits Enforced automatically, no human needed
Catch degradation early Alerts on error rate/latency Fires before users complain
Understand a spike Sessions, Users, Segments Shows who and what caused it
Custom thresholds HQL queries Anything the standard charts miss

If you only do one thing, set an alert on error rate and request volume per customer before you set precise limits — you'll learn your real traffic shape first, then tune the limits to match. Helicone offers a free trial without a credit card, which is enough to validate the setup on live traffic; see Helicone for the current plan details.

How do I use Helicone's prompt playground and datasets to improve prompts?

Helicone's Playground and Datasets features are designed as a paired workflow: capture real traffic, curate it into a testable set, then iterate on prompts against that set. Based on the product page, the platform bundles "Improve Prompts," "Datasets," and "Playground" alongside request logging, segments, sessions, and HQL querying — so the improvement loop runs on data you already have rather than on hand-written examples.

H3. A practical loop

  1. Collect. Let production (or staging) requests flow through the gateway so requests, sessions and users are logged.
  2. Filter. Use Segments or HQL to isolate the cases you care about — a specific user cohort, a failing intent, high-latency calls, or thumbs-down feedback.
  3. Save as a dataset. Turn that filtered slice into a Datasets collection. This freezes a representative sample so later prompt versions are compared against the same inputs.
  4. Experiment in the Playground. Load the dataset, edit the prompt, change the model or parameters, and run the set in one pass instead of one request at a time.
  5. Compare and ship. Keep the variant that wins on your criteria, then watch Rate Limits, Alerts and live dashboards after rollout to catch regressions.

H3. Who benefits most

  • Small teams without an eval harness. The appeal is skipping bespoke tooling: the same place that logs traffic also stores the test set and runs the experiment.
  • Teams debugging specific complaints. Segments plus sessions let you pull the exact conversation a user complained about into a dataset rather than reconstructing it.
  • Prompt-heavy products. If prompts change weekly, a frozen dataset is what stops each change from being a guess.

The trade-off is that datasets built from production traffic inherit its biases. A sample of easy requests will make every prompt look good, so deliberately include edge cases and failures, and refresh the set as usage shifts.

H3. Choosing between this and a dedicated eval tool

Situation Helicone's Playground + Datasets Dedicated eval framework
Data already logged in Helicone Low friction, no export step Requires piping data out
Need custom scoring code, CI gates Limited to what the platform offers Strong fit
Quick prompt iteration by hand Fast, visual More setup than needed
Long-term regression suite in CI Workable but not the core strength Purpose-built

If your main need is "look at real requests, tweak the prompt, see if it got better," the integrated path is usually faster. If you need automated graders and blocking checks in a pipeline, expect to complement it.

H3. Next step

Pick one recurring failure — a support intent, a formatting error, a refusal — filter for it, save roughly 20–50 examples as a dataset, and run two prompt variants in the Playground. That single comparison tells you whether the workflow fits your team before you invest in building larger sets. For background on the gateway and observability side, see Helicone.

Related questions

More questions →
What observability and debugging features does Helicone provide for LLM apps?

Helicone is an LLMOps platform that combines an AI gateway with observability tooling, so you can route, debug, and analyze LLM traffic in one place. Its observability and debugging features are aimed at teams that need request-level visibility into prompts and model calls, plus the ability to turn that data into prompt improvements. The platform is positioned for "routing and monitoring for reliable AI apps," and the site offers a free trial with no credit card required for 7 days, so you can evaluate whether its monitoring and debugging surface fits your stack before committing.

Request-level monitoring and debugging

The core of Helicone's observability is request-level monitoring. Instead of treating LLM calls as opaque, it captures the traffic flowing through your application so you can inspect individual requests and understand what happened.

  • Requests — a view of the calls your app makes, giving you a per-request record to debug from.
  • Sessions — grouping related requests so you can follow a multi-step or multi-turn interaction as a unit rather than as isolated calls.
  • Users — attributing activity to specific users, which helps when you need to trace an issue back to a particular person or cohort.
  • Segments — slicing your traffic into subsets so you can compare behavior across different parts of your application.

For debugging, this means you can move from a broad symptom ("something is slow or wrong") down to the specific request, session, or user responsible, rather than guessing.

Prompt improvement: Playground and Datasets

Observability data is only useful if it feeds back into better prompts. Helicone pairs its monitoring with tooling for prompt work:

  • Playground — a place to iterate on prompts, so you can test changes against your models.
  • Datasets — collections of data you can use to evaluate and improve prompts systematically.

Together these support the loop of "observe real traffic → build a dataset → test prompt changes → ship improvements," which is the practical reason to care about request-level data in the first place.

Analytics and querying with HQL

Beyond browsing individual requests, Helicone provides analytical views and a query layer:

  • Dashboard — an overview of your usage and activity.
  • HQL — a query capability for pulling custom answers out of your LLM data, useful when the built-in views don't cover the question you have.

This is the difference between debugging one bad request and answering aggregate questions like "how does this segment behave over time" or "which users hit this pattern."

Operational monitoring: rate limits and alerts

Observability also covers keeping the app running, not just understanding it after the fact:

  • Rate Limits — controls to manage how much traffic is allowed.
  • Alerts — notifications when something needs attention.

These turn monitoring into something proactive: you find out about a problem from an alert instead of from a user.

How to decide if it fits your use case

If you need to… Relevant Helicone capability
Debug a specific bad LLM call Requests
Follow a multi-turn interaction Sessions
Trace issues to a specific user Users
Compare behavior across app areas Segments
Iterate and test prompts Playground, Datasets
Answer custom analytical questions HQL, Dashboard
Control traffic volume Rate Limits
Get notified of problems Alerts

If your main need is request-level visibility into prompts and model calls, plus a path from that data to prompt improvements, these features map directly onto that workflow. If you only need basic logging with no analytics or prompt tooling, the broader surface may be more than you need. The practical next step is to use the free trial to send real traffic through and check whether the Requests, Sessions, and HQL views answer the questions you actually ask about your app.

Where to Find Helicone's Official Signup and Pricing Pages

Helicone's official entry point is its homepage at helicone.ai, which links directly to both the free trial signup and the pricing page at helicone.ai/pricing. The site advertises a 7-day free trial with no credit card required, so you can start evaluating the platform before committing to a paid plan.

Main Entry Points

Purpose Where to go What you'll find
Learn what Helicone does helicone.ai (homepage) Product overview: AI Gateway, LLM observability, routing, debugging, analytics
Start a free trial Signup flow linked from the homepage 7-day free trial, no credit card required
Compare plans and costs helicone.ai/pricing Official pricing details

What You Can Explore From the Homepage

The site positions Helicone as an LLMOps platform for routing, debugging, and analyzing AI applications, used by what it describes as the world's fastest-growing AI companies. From the homepage you can navigate to feature areas including:

  • Dashboard — requests, segments, sessions, and users
  • HQL — a query layer for analyzing your LLM traffic
  • Improve Prompts — datasets and a playground for prompt iteration
  • Monitor — rate limits and alerts

These are the areas most relevant if you're evaluating whether Helicone fits your stack before signing up.

Practical Notes Before You Sign Up

  • The homepage states the trial requires no credit card, which lowers the barrier to testing the AI Gateway and observability features.
  • Pricing specifics (tiers, usage limits, overage rules) are only authoritative on helicone.ai/pricing — check there rather than relying on third-party summaries.
  • If your goal is routing and monitoring production traffic, plan to test the Gateway and Dashboard during the trial window so you can judge fit before the 7 days end.

Quick Answer

Go to helicone.ai for the official homepage and trial signup, and helicone.ai/pricing for plan details. Both are the primary sources for deciding whether to adopt Helicone.

How Helicone's AI Gateway Helps Route and Monitor AI App Requests

Helicone is an LLMOps platform that sits between your application and your LLM providers, acting as a gateway that routes requests and a monitoring layer that records what happens to them. It's aimed at teams building AI apps who need to debug, analyze, and keep those apps reliable in production. The site describes it as "the LLMOps platform behind the fastest-growing AI companies," with routing and monitoring for reliable AI apps. You can try it with a 7-day free trial and no credit card required, per the site's own signup messaging.

What the AI Gateway does

The gateway is the piece that intercepts traffic between your app and the model providers. Instead of your code calling OpenAI, Anthropic, or another provider directly, requests pass through Helicone. That single insertion point is what makes the rest of the platform possible: because every request flows through one place, Helicone can route it and record it.

Routing here means directing requests to a model or provider. The practical value is that you change routing behavior at the gateway rather than rewriting call sites across your codebase. The site frames the overall product around three verbs — route, debug, and analyze — which maps cleanly onto the gateway (route) and the observability layer (debug, analyze).

What you can monitor

Once requests flow through the gateway, Helicone exposes them across several dimensions. The dashboard navigation on the site lists these views:

View What it covers
Requests Individual calls through the gateway
Segments Grouped slices of traffic
Sessions Related requests treated as one session
Users Activity attributed to specific users
HQL A query interface over your request data
Improve Prompts Prompt-level iteration
Datasets Collected data for evaluation or testing
Playground Experimenting with prompts/models
Monitor Rate limits and alerts

The distinction between Requests, Sessions, and Users matters for debugging. A single user action in your app may trigger several LLM calls; viewing them as a session lets you see the whole interaction rather than isolated calls. Attributing traffic to users lets you answer "which users are hitting errors or high latency" rather than only "how many calls failed."

How this supports reliability

Reliability work on AI apps usually comes down to three questions: what did the model actually receive and return, which requests are failing or slow, and what changed when quality dropped. The gateway-plus-observability combination addresses each:

  • What happened — every request is logged as it passes through, so you have the actual prompt and response rather than a reconstruction.
  • Where it's failing — the Monitor view covers rate limits and alerts, so you can catch provider throttling or error spikes instead of discovering them from user complaints.
  • What to change — Improve Prompts, Datasets, and Playground give you a place to iterate on prompts and test them against collected data.

HQL is worth calling out separately: it's a query interface over your request data, which means you can ask specific questions of your logs (for example, filtering to a time window or a user segment) instead of only reading a fixed dashboard.

Where it fits in an LLMOps stack

Helicone's positioning is as an LLMOps platform, and the gateway is the mechanism that makes the platform's data complete. Observability tools that rely on SDK-level instrumentation only see what your code reports; a gateway sees the traffic itself. That's the architectural reason routing and monitoring are bundled here rather than sold as separate concerns — the routing layer is what produces the monitoring data.

If you're evaluating it, the useful question isn't "does it log requests" but "does routing through a gateway fit how my app is built." If you already call providers directly from many services, inserting a gateway is an architectural change; if you're early or centralizing LLM access anyway, the gateway is a natural place to put that boundary.

Getting started

The site offers a free trial with no credit card required for 7 days. To evaluate it against your own traffic, the practical sequence is: route a small share of requests through the gateway, confirm the Requests view shows them, then check whether Sessions and Users line up with how you think about your app's activity. If those views match your mental model, the debugging and alerting features are worth the setup cost; if they don't, that mismatch is itself useful information before you commit further.

What to Check Before Trying or Buying Helicone

Helicone is an LLMOps platform that combines an AI gateway with observability for LLM applications. Before you try or buy it, confirm four things: whether the free trial terms fit your timeline, what the pricing page actually says about cost, whether your use case matches its routing/debugging/analytics capabilities, and whether your team profile fits the "fastest-growing AI companies" positioning it claims. The site states you can try for free with no credit card required and a 7-day free trial, so the trial itself is low-friction — the real work is verifying fit and cost.

1. Confirm the trial terms and what "free" covers

The homepage evidence is explicit: "Try for free. No credit card required, 7-day free trial."

What this means for your decision:

  • No credit card required — you can start without entering payment details, which lowers the commitment of an initial evaluation.
  • 7-day free trial — the evaluation window is one week. Plan your test around that: pick one or two real LLM workflows, not a broad tour, so you can judge fit before the window closes.
  • "Try for free" is not the same as "free tier." The evidence describes a trial, not an ongoing free plan. Do not assume continued free usage after 7 days.

What to verify yourself: whether the trial includes the full feature set (gateway, monitoring, analytics) or a subset, and what happens to your data and configuration when the trial ends.

2. Read the pricing page before you commit

The site links to an official pricing page at https://www.helicone.ai/pricing. The input does not include the actual pricing figures, tiers, or billing model — so treat the pricing page as the source of truth and check it directly.

Questions to answer from that page:

  • Is pricing based on requests, tokens, seats, or a flat subscription?
  • Is there a usage-based component that could scale with your traffic?
  • What is included at each tier, and where do gateway vs. observability features sit?
  • Are there overage charges or rate limits tied to a plan?

Because no payment platforms or price points are listed in the available evidence, do not assume Helicone is free, cheap, or priced per-seat. Confirm from the page.

3. Match your use case to the core capabilities

Helicone positions itself around three verbs: route, debug, and analyze. The dashboard evidence lists concrete surfaces you can evaluate against your own needs:

Capability area What the evidence shows Check this if you need…
Routing / gateway AI Gateway for routing requests Multi-provider or multi-model routing, failover, or centralized request handling
Debugging Requests, Sessions, Users views Tracing individual calls, grouping by session, or inspecting per-user behavior
Prompt improvement Improve Prompts, Datasets, Playground Iterating on prompts and testing them against datasets
Monitoring Rate Limits, Alerts Guardrails on usage and notifications when something breaks
Analysis Dashboard, Segments, HQL Segmenting traffic and running structured queries over your LLM data

How to test fit in the trial: route one real application through the gateway, then check whether the Requests and Sessions views give you the debugging detail you actually use. If you rely on custom querying, try HQL and Segments early — these are the features most likely to determine whether the platform replaces or supplements your existing tooling.

4. Check team and scenario fit

The homepage frames Helicone as "the LLMOps platform behind the fastest-growing AI companies" and says "the world's fastest-growing AI companies rely on Helicone."

That positioning tells you who it is built for — teams shipping AI applications at pace — but it is a marketing claim, not a specification. Use it as a signal, not a guarantee. Ask:

  • Do you operate LLM features in production? Observability and gateway tooling matter most once you have real traffic to route and debug.
  • Are you multi-provider or planning to be? The gateway value is highest when you need to route across models or providers.
  • Do you have someone who will act on the data? Alerts, rate limits, and analytics only pay off if a person or process responds to them.
  • Is your team small enough that a managed platform beats building in-house? If you already have mature internal tracing, evaluate whether Helicone adds routing and gateway value on top.

A practical pre-purchase checklist

  1. Read https://www.helicone.ai/pricing and note the billing model and tier limits.
  2. Start the 7-day trial (no credit card required) and route one real workflow through the gateway.
  3. Verify the Requests, Sessions, and Users views give you the debugging depth you need.
  4. Test Improve Prompts, Datasets, and Playground if prompt iteration is a priority.
  5. Configure Rate Limits and Alerts to confirm the monitoring workflow fits your ops process.
  6. Try HQL and Segments if you need custom analysis.
  7. Before the trial ends, confirm what happens to your data and configuration, and whether the paid tier's limits match your expected traffic.

The trial is designed to be easy to start. The decision hinges on the pricing page and whether the routing, debugging, and analytics surfaces match how your team actually works.

What is Helicone and what does it do?

Helicone is an AI Gateway and LLM observability platform for teams building AI applications. It sits between your app and your model providers to route requests, then records and analyzes what happens so you can debug prompts, monitor usage, and keep applications reliable. It is aimed at developers and AI product teams rather than end users, and the site offers a free trial with no credit card required for 7 days.

The two halves of the product

Helicone's own description splits its role into two connected jobs:

  • AI Gateway — routing layer for model requests. Instead of calling each provider directly, requests pass through Helicone, which gives you one integration point and a place to apply controls.
  • LLM observability — monitoring and analysis of those requests. Because traffic already flows through the gateway, the platform can log and surface what your application is actually doing.

The practical benefit is that routing and monitoring share the same data. You do not need a separate logging pipeline bolted onto your model calls.

What you can actually do with it

The homepage lists the following capabilities:

Area What it covers
Dashboard Requests, segments, sessions, and users
Improve prompts Datasets and a playground
Monitor Rate limits and alerts
Query HQL, a query language for your request data

Read together, these map to a fairly standard LLMOps workflow: send traffic through the gateway, inspect individual requests and group them by session or user, iterate on prompts in the playground against saved datasets, then set rate limits and alerts so problems surface before users report them.

Who it is for

Helicone positions itself around "the world's fastest-growing AI companies" and teams that need to "route, debug, and analyze" their applications. In practice that means:

  • You are already calling an LLM API from an application.
  • You have more than one prompt or model in play, or expect to.
  • You need visibility into cost, latency, errors, or per-user behavior.
  • You want prompt iteration to be a repeatable process rather than ad-hoc testing.

If you are prototyping a single prompt with no users, the observability layer adds little. The value appears once traffic, variants, or multiple providers make manual inspection impractical.

How to evaluate it

  1. Start the free trial — the site states no credit card is required and the trial runs 7 days.
  2. Route a small slice of real or test traffic through the gateway rather than migrating everything at once.
  3. Check the dashboard for requests, sessions, and users to confirm the data matches what your app sent.
  4. Use the playground and datasets to test a prompt change against recorded examples.
  5. Configure rate limits and alerts, then verify they fire under a deliberate test condition.

The main thing to confirm during a trial is whether the gateway integration fits your existing stack without meaningful refactoring. If routing through a third party is a constraint for your architecture or data handling, that is a blocker regardless of the observability features.

What the page does not answer

The homepage excerpt does not specify supported model providers, SDKs, self-hosting options, or what happens to data after the trial ends. Pricing beyond the trial is linked but not described in the available material. If any of those matter for your decision — particularly data residency or provider coverage — check the pricing page and documentation directly before committing.

Website Overview

The available information shows a mix of normal operation and configuration gaps. Depending on how the website is used, these gaps may affect secure access or the consistency of its public presentation.

Domain and Registration

Transfer-protection status is present, helping reduce the risk of unauthorized domain transfers. The domain has about 3 years of registration history; its current configuration provides more context than age alone. The registrar is NameCheap, Inc., a widely used domain service provider. Registration contact information is publicly available through RDAP. The domain uses the common .ai extension, which is not an independent safety signal.

DNS and Email

Nameservers are provided by Cloudflare, indicating managed DNS hosting. MX records point to the Google Workspace email service. No CNAME was found; the observed records resolve directly to addresses. SPF and DMARC are configured. DKIM status is unknown. TXT records include verification markers for Google. Such markers may also remain after a service stops being used.

TLS and Certificates

The public key uses EC with 256 bits. The server supplied a complete certificate chain. No organization name is present in the certificate; the available fields are consistent with domain validation. The certificate was issued within the Google Trust Services cloud or CDN ecosystem. The certificate's total validity is about 90 days, consistent with a short renewal cycle.

HTTP and Browser Security

The response lacks these common security headers: CSP, X-Content-Type-Options, Referrer-Policy, Permissions-Policy, clickjacking protection. CORS permits any origin to read this response. This is common for public resources; sensitive responses need narrower handling. No X-Powered-By header was found, reducing one common source of backend fingerprinting information. The cf-ray response header indicates a CDN or caching proxy in the delivery path. No obvious internal addresses or debug information were found in the headers.

Technology Stack Analysis

The public page identifies Next.js, Google Analytics, Cloudflare, Vercel without precise versions, leaving fewer clues for version-specific scanning.

Search and Social Sharing

No homepage canonical URL was detected. If duplicate URLs exist, consolidation may be less explicit. Twitter Card metadata is configured. The title has 41 characters, within a common display range. A meta description is present, with 106 characters. The observed directives allow indexing and link following.

Hosting and Email

DNSCloudflare
HostingVercel
EmailGoogle Workspace
Location United States flagUnited States 2606:4700::6812:667

User reviews (0)

  • No reviews yet.

Pages, Search and Sharing

Meta descriptionRouting and monitoring for reliable AI apps - the LLMOps platform behind the fastest-growing AI companies.
Canonical URLNot detected
LanguageEnglish (default)
Twitter Cardsummary_large_image
twitterbot 1 allowed · 0 disallowed
  • Allow/
All bots 1 allowed · 10 disallowed
  • Allow/
  • Disallow/*?
  • Disallow/*%
  • Disallow/v1*
  • Disallow/v2*
  • Disallow/help/
  • Disallow/oss/
  • Disallow/api/
  • Disallow/tags/
  • Disallow/devops/
  • Disallow/icon.ico

Registration details RDAP / WHOIS

RegistrarNameCheap, Inc.
Registered2022-11-14
Expires2026-11-14
Domain statusclient transfer prohibited
Nameservershattie.ns.cloudflare.com、marty.ns.cloudflare.com
DNSSECunsigned

DNS records

TypeNameValueTTLPriority
Awww.helicone.ai104.18.6.103300—
Awww.helicone.ai104.18.7.103300—
AAAAwww.helicone.ai2606:4700::6812:667300—
AAAAwww.helicone.ai2606:4700::6812:767300—
MXhelicone.aiaspmx.l.google.com36001
MXhelicone.aialt1.aspmx.l.google.com36005
MXhelicone.aialt2.aspmx.l.google.com36005
MXhelicone.aialt3.aspmx.l.google.com360010
MXhelicone.aialt4.aspmx.l.google.com360010
NShelicone.aihattie.ns.cloudflare.com86400—
NShelicone.aimarty.ns.cloudflare.com86400—
TXThelicone.aigoogle-site-verification=a9S_xt-kHo93a-wN0TVBYzhTOX_tlQtRRb7c4ajFyzM300—
TXThelicone.aigoogle-site-verification=d340NM4PQ9thwK4NCcir65UzVhkn7pxt7YJY7QOzWYw300—
TXThelicone.aiv=spf1 include:_spf.google.com ~all300—
DMARC_dmarc.helicone.aiv=DMARC1; p=none; rua=mailto:[email protected]300—

TLS and certificates

AssessmentNormal configuration
Supported protocolsTLSv1.2、TLSv1.3
Negotiated protocolTLSv1.3
Certificate subjecthelicone.ai
IssuerGoogle Trust Services
Valid until2026-11-03T19:38 · Remaining when checked: 33 days
Verification detailsCertificate trust: Passed · Hostname match: Passed

HTTP response headers

HeaderValue
content-typetext/html; charset=utf-8
cache-controlpublic, max-age=0, must-revalidate
servercloudflare
strict-transport-securitymax-age=63072000
access-control-allow-origin*

Identified technologies

Next.jsGoogle AnalyticsCloudflareVercel