

 Paid content
 Visit website
 Updated: 2026-10-01 15:42
 Language: English (default)
 Access: Normal
 Profile views 2
  Outbound visits 0
 Website Review
What is Respan?
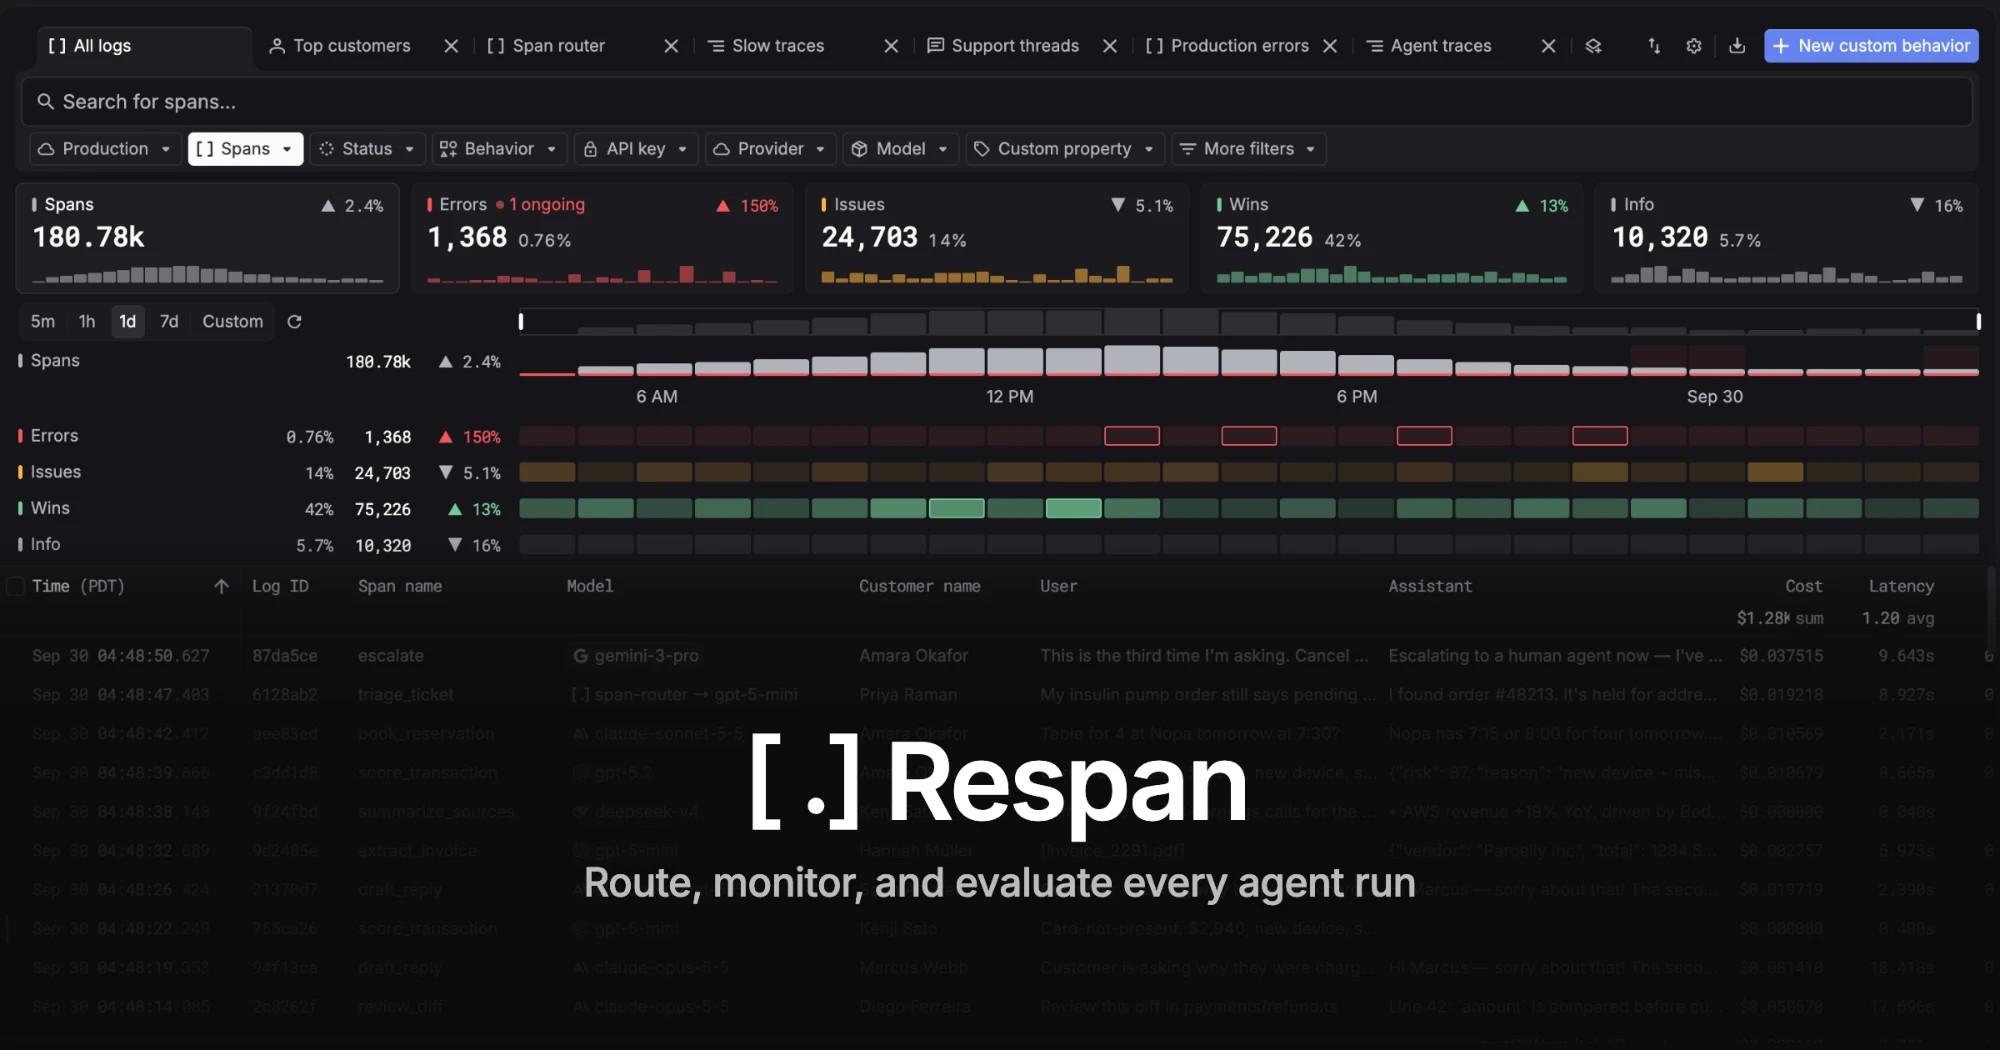
Respan is an LLM engineering platform built around a routing gateway for agent runs, with observability and automated evaluation layered on top. Rather than picking one model provider and building monitoring separately, teams route requests through Respan to reach multiple models, watch live traffic, and score outputs against evals in the same place.
Its four stated capabilities map to a typical agent lifecycle:
- Routing and failover — send each run to the model you want and keep serving when one provider degrades.
- Version selection by score — compare prompt or model versions and ship the one that performs best on your evals.
- Change detection — get alerted when quality or behavior shifts, instead of finding out from users.
- Agent tracing — inspect the individual steps an agent took to understand where a run went wrong.
Who it fits
Teams already running LLM features in production, or close to it, benefit most. If you are prototyping a single prompt against one provider, a gateway plus eval suite adds overhead you do not need yet. The value appears once you have multiple models, multiple prompt versions, or multi-step agents where failures are hard to reproduce by hand.
How to evaluate it
Start with one high-traffic agent run and ask three questions: can Respan route it without changing your application code, does its tracing show the step-level detail you currently lack, and can you define an eval that catches a regression you have actually experienced? If all three are yes, expand from there. Pricing details live at Respan. For comparison, general-purpose observability tools such as Langfuse and gateway-focused options like OpenRouter overlap in parts of this space, though each centers on a different piece of the problem.
How does Respan's AI router keep applications running when a model provider goes down?
Respan's router sits between your application and the model providers, so your code calls one endpoint rather than each provider's API directly. When a provider becomes unavailable, the router can send the request to another configured model instead of returning an error to your users. The page frames this as "Reach every model, and stay up," which points to two linked ideas: broad model access plus continuity when something on the provider side breaks.
What that means in practice:
- Failover routing. You define which models can substitute for each other. If the primary provider times out or errors, the router retries against a fallback.
- One integration point. Your app keeps a single API shape, so adding or swapping providers doesn't require rewriting client code.
- Observability alongside routing. Because traffic passes through the router, it can log each run and flag when behavior changes — the "Know the moment things change" heading.
- Evaluation before promotion. The "Ship the version that scores best" heading suggests routing decisions can be tied to eval results rather than guesswork.
A concrete scenario: a support agent's primary model starts returning 503s during a traffic spike. With a fallback configured to a comparable model, requests continue, and the run logs show the switch so you can confirm quality didn't drop. Without a router, that same spike becomes user-visible errors unless you've built failover logic yourself.
The trade-off is that fallback models are rarely identical. A cheaper or faster substitute may handle long-context prompts or tool calls differently, so test your fallback path with the same evals you use for the primary. Also decide whether failover should be automatic or alert-only — automatic keeps uptime but can mask a degrading provider.
Next step: list your two or three most critical model calls, pick a fallback for each, and run your existing test prompts through both to see where outputs diverge. For pricing and plan limits, check Respan. If you're comparing approaches, OpenRouter is a well-known routing option, though its focus differs from a platform that pairs routing with evals.
How do I use Respan's automated evals to decide which model or prompt version to ship?
Respan is built around a single loop: route traffic, observe every run, then let automated evals score the results so you can promote the version that performs best. For a ship/no-ship decision, that means your choice of model or prompt version should come from eval scores on real traffic, not from a one-off benchmark run.
A practical workflow
- Define the task and a scoring rule. Decide what "good" means for your use case — exact match on a classification label, a rubric-graded quality score, or a pass/fail on required facts. Automated evals need a machine-checkable target.
- Build a fixed eval set. Take a representative sample of real inputs, including the awkward ones: ambiguous queries, long context, edge-case formatting. Keep this set stable so scores are comparable across versions.
- Run each candidate. Point the router at model A and model B, or prompt v1 and v2, and let the eval suite score both on the same inputs.
- Compare on more than the average. A version that wins on mean score but fails badly on 5% of inputs may be worse to ship than a slightly lower-scoring, more consistent one.
- Watch production after you ship. The observability layer shows whether live behaviour matches what the eval set predicted.
How to choose between versions
| Situation | What to weigh |
|---|---|
| Two versions score close together | Prefer the cheaper, faster, or more stable one — the quality difference may not justify the cost |
| One wins on quality, loses on latency/cost | Decide which constraint your users actually feel; for interactive agents, latency often wins |
| Scores differ only on rare inputs | Check whether those inputs matter to your business before switching |
| New model released, no eval history | Re-run your existing eval set rather than trusting vendor benchmarks |
Where this fits
The routing and eval combination suits teams running agents in production who need to change models or prompts without breaking behaviour — for example, a support agent where you want to test a cheaper model on simple tickets while keeping a stronger one for escalations. It is less useful if you have no labelled or rubric-scored data, since automated evals need something to score against; in that case, start by collecting a small graded sample first.
Next step
Pick your ten most important real inputs, write the expected outcome for each, and treat that as v0 of your eval set. Every model or prompt change after that gets measured against it before it reaches users.
For broader context on evaluation tooling, see Langfuse and Braintrust.
How does Respan alert me when my LLM application's performance changes?
Respan's core promise is that it monitors every agent run and surfaces change as it happens — the page frames this around "Know the moment things change" and "See exactly what your agents did." In practice, that means alerting is built on top of the observability layer rather than being a separate product: because runs are logged and evaluated continuously, a shift in quality or reliability is visible in the same place you inspect individual traces.
What the alerting actually watches
The page evidence points to three signals feeding alerts:
- Automated evals — scored outputs let you alert on a drop in eval scores, not just on errors. This catches the failure mode where responses still return successfully but get worse.
- Observability metrics — latency, error rates and throughput per model or per route, since Respan also acts as a gateway in front of your models.
- Routing changes — because Respan routes requests across models, a fallback or provider switch is an event worth knowing about, as it can silently change output character.
A concrete scenario
You run a support agent that routes between two models, with a cheaper one as fallback. Your eval score sits at 0.91. Overnight the primary provider degrades, traffic shifts to the fallback, and scores drop to 0.78 — still no HTTP errors, so a conventional uptime monitor stays silent. If evals run on sampled production traffic, that gap is the alert. You then open the traces for the affected window and compare the two models on the same inputs.
How to decide whether this fits you
| Your situation | Why it matters |
|---|---|
| Multi-model or multi-provider routing | Alerts tied to routing events are directly relevant |
| You already have uptime/error monitoring | Respan adds quality and eval-based alerting, not a replacement for infra monitoring |
| Single model, stable prompts | The value is mostly in eval drift detection, which you can also get from narrower tools |
| Strict data residency needs | Check where traces and eval data are stored before committing |
Next step
Before relying on alerts, define what "performance changed" means for your app: a specific eval threshold, a latency percentile, or a routing-shift event. Then confirm with Respan which of those can trigger a notification and through which channels — the page describes the monitoring and eval capabilities but does not specify notification channels or thresholds, so that detail needs verification directly. You can review plan-level differences at Respan pricing.
For comparison, established alternatives in this space include Langfuse and Helicone for observability, and Braintrust for eval-centric workflows.
Can Respan trace and inspect individual agent runs to debug what my agents actually did?
Yes. Respan is built around tracing and inspecting individual agent runs, which is the core of debugging "what did my agent actually do?" Its page highlights routing, monitoring, and evaluating every agent run, with a heading promising you can "see exactly what your agents did."
H3 How that helps in practice For debugging, the value is in per-run visibility rather than aggregate dashboards. If a user reports a wrong answer, you want to open that single run and walk through the steps: which model was called, what prompt or context went in, what came back, and how the agent decided its next action. Respan's framing of a unified gateway plus observability means the trace and the routing decision come from the same layer, so you can see not just the output but which model handled it and why.
H3 A concrete scenario Say your support agent gives a refund it shouldn't have. With run-level tracing you would:
- Find the specific run by user or timestamp.
- Inspect the tool call the agent made and the arguments it passed.
- Check the retrieved context that fed the decision.
- Compare against a run where the agent behaved correctly.
- Turn that failing case into an eval so it doesn't regress.
That last step is where Respan's automated evals connect to debugging: a bad run becomes a test case.
H3 Trade-offs to weigh Per-run inspection is most valuable for multi-step or tool-using agents, where failures are hard to reproduce. For simple single-prompt apps, a logging layer may be enough. Also consider how much of your stack runs through Respan's gateway — tracing is deepest when calls route through it, and thinner for traffic that bypasses it.
H3 Next step Open a recent failing run and trace it end to end before changing any prompt. If the trace shows a routing or context problem rather than a model-quality problem, fix that first. For comparison, other observability tools include Langfuse and LangSmith, which take similar per-run tracing approaches.
How much does Respan cost and what are the pricing tiers?
Respan's page doesn't publish dollar figures in the material provided; it only links to a pricing page, so treat any specific number you see elsewhere as something to verify directly at Respan before budgeting.
What you can infer about how it's priced
Products like this — an AI router plus observability and automated evals — are usually billed on usage rather than a flat seat fee, because the costs they sit in front of (model calls, logged traces, eval runs) scale with traffic. The page's four headline claims point to where metering would naturally land:
- Routing across models ("Reach every model, and stay up") — typically charged per request or per token proxied through the gateway.
- Observability ("Know the moment things change", "See exactly what your agents did") — usually tied to trace or span volume and retention window.
- Automated evals and prompt optimization ("Ship the version that scores best") — often counted per eval run or per scored example.
- Team access — seats, roles, and SSO are the usual enterprise-tier dividers.
A practical way to decide
Estimate your monthly request volume and trace volume first, then ask Respan two questions: what counts as a billable unit, and whether observability data is retained and charged after a set period. If you run high traffic but evaluate rarely, a usage-based router fee may dominate; if you evaluate constantly on low traffic, eval runs will.
As a next step, open the pricing page and compare it against a general-purpose gateway such as OpenRouter if routing alone is your need, or Langfuse if you mainly want tracing and evals — the split tells you whether you're paying for one job or three.
 Hosting and Email
 Cloudflare
 Hosting
 Vercel
 Google Workspace
 Location
 United States
 Pages, Search and Sharing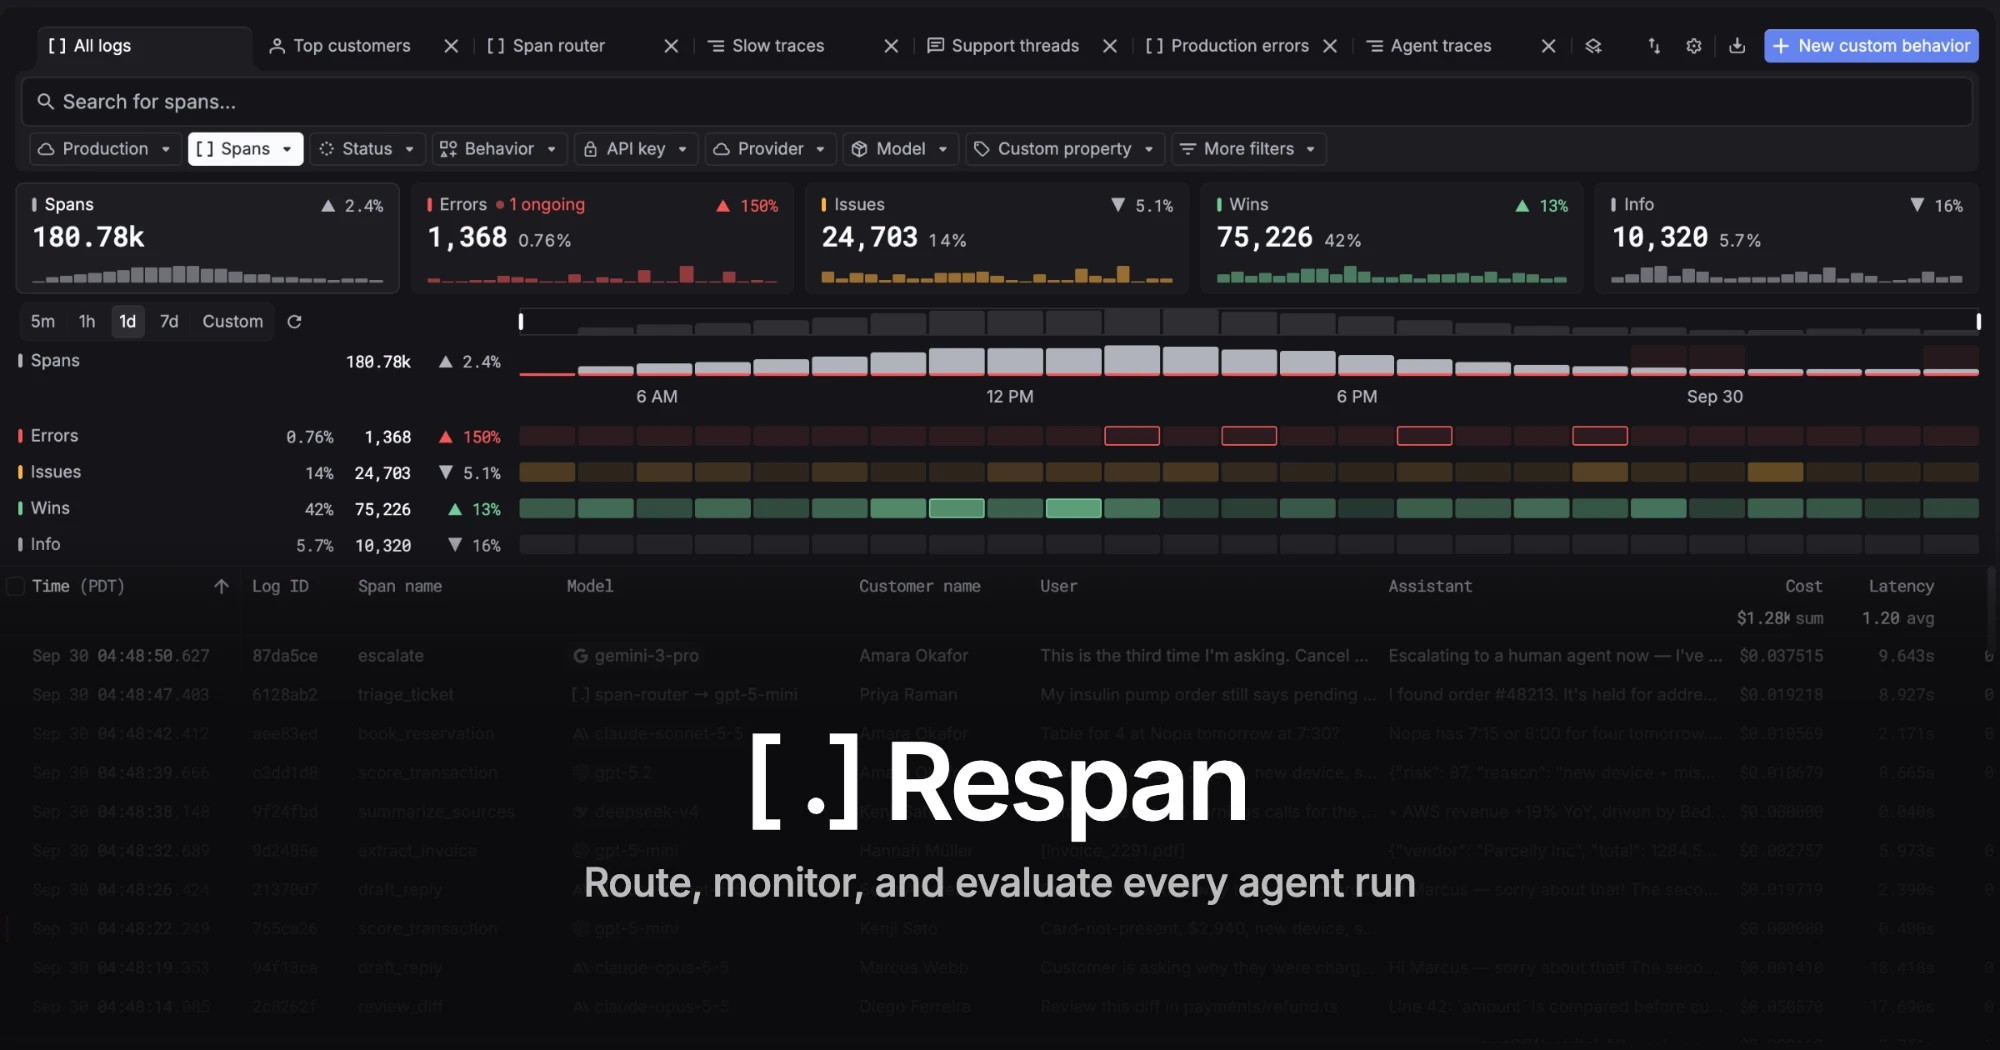



 All bots

 Registration details

 Identified technologies
User reviews (0)